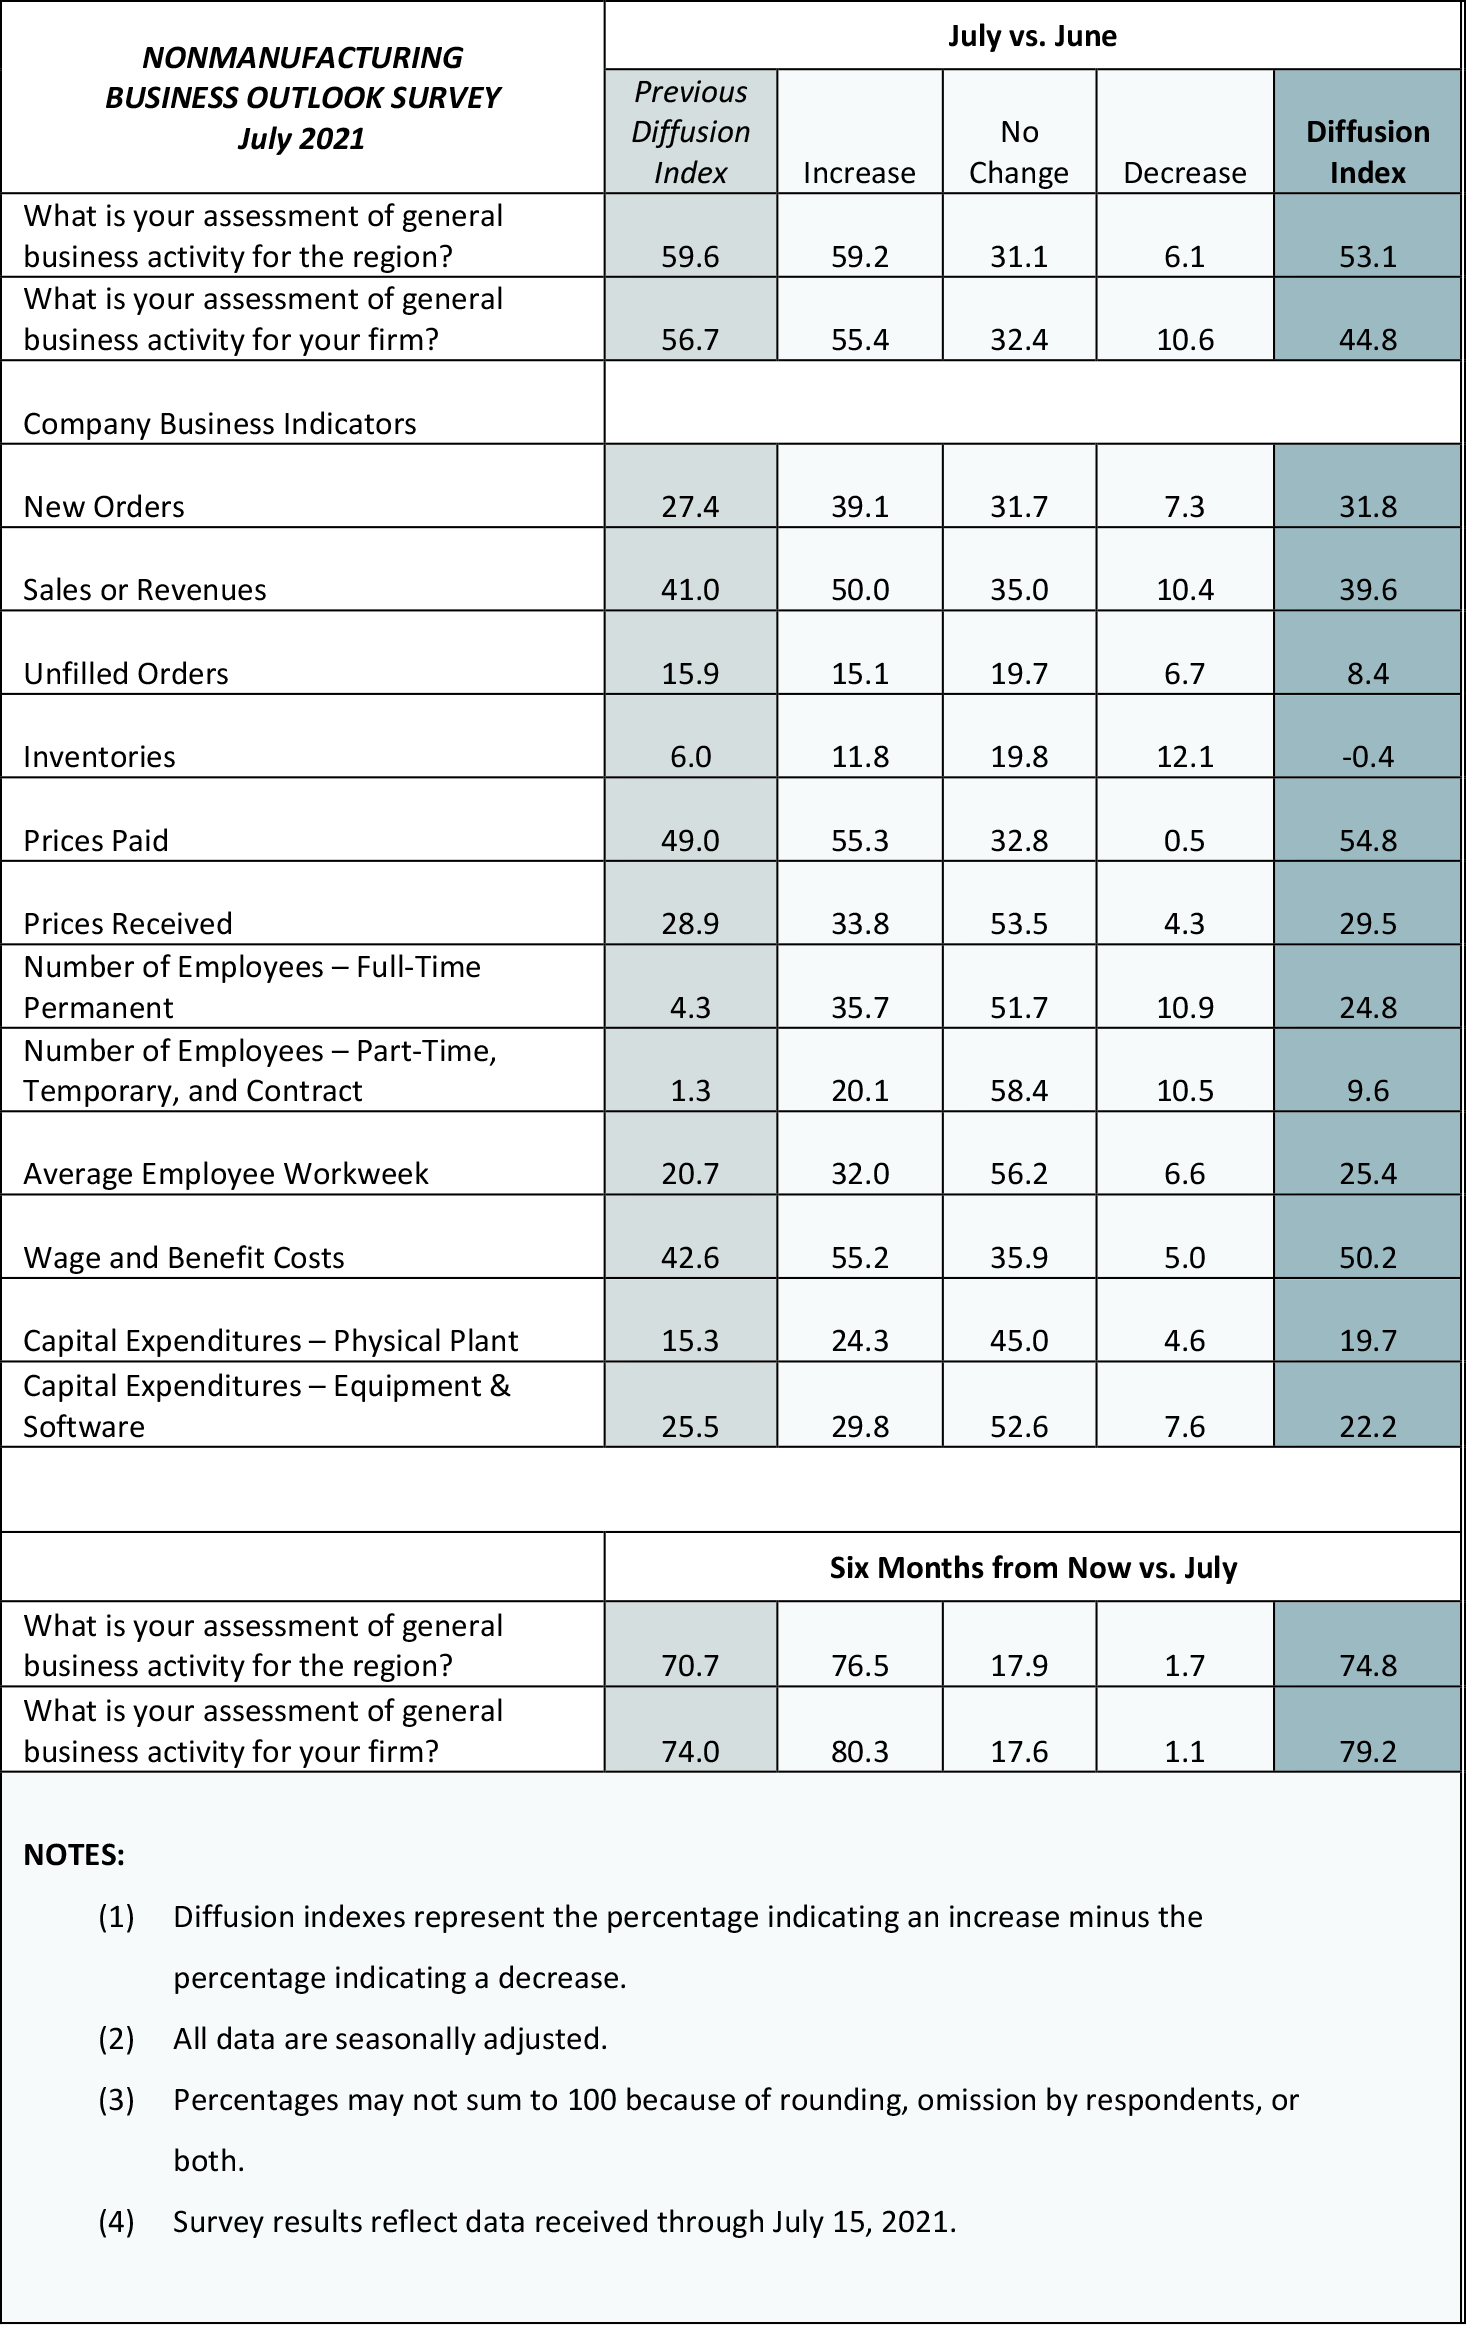
Responses to the July Nonmanufacturing Business Outlook Survey suggest continued expansion in nonmanufacturing activity in the region. The indexes for general activity at the firm level and sales/revenues both declined but remained elevated, and the new orders and full-time employment indexes both rose. Prices for firms' inputs and own goods continued to rise, suggesting more widespread price increases. The respondents continue to anticipate growth over the next six months.
Current Indexes Remain Positive
The diffusion index for current general activity at the firm level remains elevated but declined from a reading of 56.7 in June to 44.8 this month (see Chart 1). More than 55 percent of the responding firms reported increases in activity, and 11 percent reported decreases. The new orders index increased 4 points to a reading of 31.8 in July, and the index for sales/revenues edged down from 41.0 in June to 39.6 this month. Of the responding firms, 50 percent reported increases in sales/revenues, while 10 percent reported decreases. The regional activity index declined by 7 points to 53.1.
Employment Indicators Strengthen
The full-time employment index more than recovered its decline from June, rising 21 points to 24.8 in July. Nearly 36 percent of the firms reported increases (up from 20 percent last month), and 11 percent reported decreases (down from 15 percent last month); meanwhile, the majority (52 percent) reported steady full-time employment levels. Similarly, the part-time employment index rose 8 points to 9.6, and the average workweek index increased 5 points to 25.4.
Respondents Continue to Report Overall Price Increases
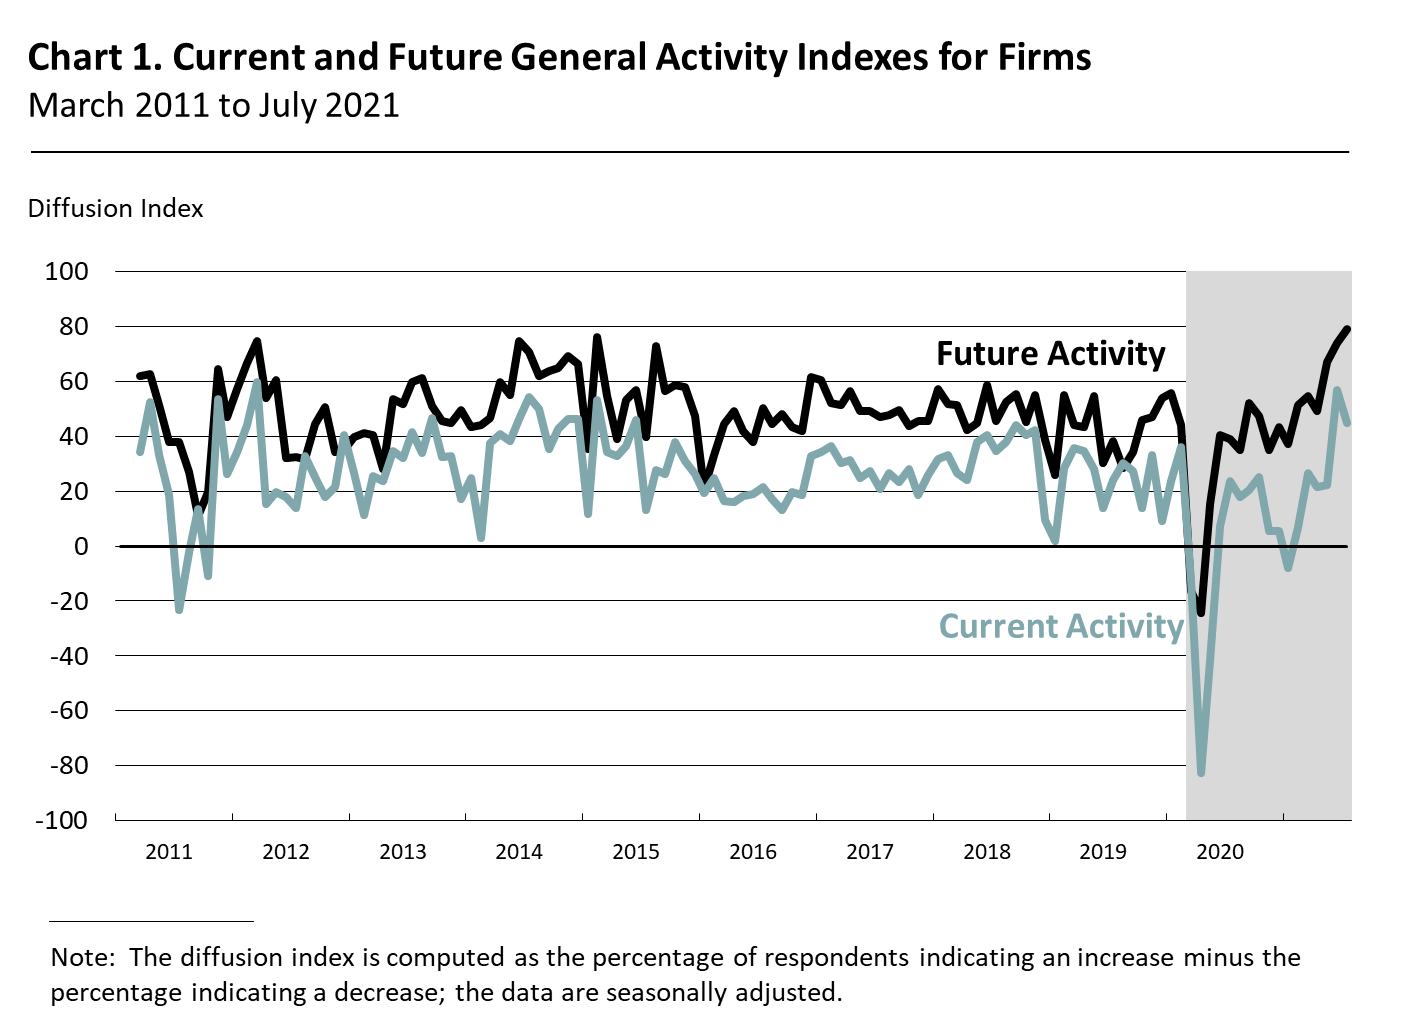
Price increases were more widespread this month. The prices paid index had hit its all-time high in May, but the index this month climbed 6 points above that mark to 54.8 (see Chart 2). More than 55 percent of the respondents reported increases in their input prices, and only 1 percent reported decreases. Just about one-third of the respondents reported stable input prices. Regarding prices for firms' own goods and services, the prices received index inched up from a reading of 28.9 in June to 29.5 in July. The share of firms reporting increases in prices received (34 percent) exceeded the share reporting decreases (4 percent). Most firms (54 percent) reported steady prices for their own goods and services.
Firms Report Increases in Wages and Compensation
In special questions this month, the firms were asked about changes in wages and compensation over the past three months, how these recent or planned changes will affect their budget for the rest of the year, and the components of these changes. Almost 51 percent of the responding firms indicated increases in wages and compensation costs over the past three months, 44 percent reported no change, and 1 percent reported decreases. The firms have reported adjusting their 2021 budgets for wages and compensation since the beginning of the year, with 44 percent indicating they are planning to increase wages and compensation by more than originally planned and 25 percent of the firms indicating they are planning to increase wages and compensation sooner than originally planned. Based on the median reporter, the firms expect increases of 4 to 5 percent for wages and total compensation in 2021.
Firms Anticipate Continued Growth
Both future activity indexes strengthened and suggest that firms anticipate growth over the next six months. The diffusion index for future activity at the firm level increased from 74.0 in June to 79.2 this month (see Chart 1). Over 80 percent of the firms expect an increase in activity at their firms over the next six months, compared with 1 percent that expect decreases and 18 percent that expect no change. The future regional activity index increased 4 points to 74.8 in July.
Summary
Responses to this month's Nonmanufacturing Business Outlook Survey suggest expansion in nonmanufacturing activity in the region. The indicators for firm-level general activity and sales/revenues declined modestly but remain elevated. Additionally, the firms continue to report overall increases in prices and employment. Overall, the respondents continue to expect growth over the next six months.
Special Questions (July 2021)
1. How have wages and compensation changed at your firm over the past three months?
|
Percent (%) |
| Increased |
50.6 |
| No Change |
44.4 |
| Decreased |
1.2 |
2. Since the beginning of the year, have you adjusted your budget for wages and compensation for 2021?*
|
Percent (%) |
| Yes, and we are planning to increase wages and compensation by more than originally planned. |
44.4 |
| Yes, and we are planning to increase wages and compensation sooner than originally planned. |
24.7 |
| No, we have not needed to make adjustments. |
40.7 |
| Other |
1.2 |
| *Percentages do not sum to 100 because more than one option could be selected. |
3. What percentage change in costs do you now expect for the following categories over all of 2021?**
| |
Wages
(%)
|
Health
Benefits
(%)
|
Nonhealth
Benefits
(%)
|
Wages + Health + Nonhealth (%) |
|
Decline of more than 4%
|
1.4 |
1.4 |
0.0 |
1.5 |
|
Decline of 3–4%
|
1.4 |
0.0 |
0.0
|
0.0 |
|
Decline of 2–3%
|
0.0 |
0.0 |
0.0 |
2.9 |
|
Decline of 1–2% |
0.0 |
0.0 |
0.0 |
0.0 |
| No Change |
17.8 |
46.5 |
54.4 |
16.2 |
|
Increase of 1–2%
|
0.0 |
4.2 |
2.9 |
1.5 |
|
Increase of 2–3%
|
19.2 |
4.2 |
10.3 |
14.7 |
|
Increase of 3–4%
|
17.8 |
2.8 |
13.2 |
10.3 |
|
Increase of 4–5%
|
13.7 |
8.5 |
8.8 |
16.2 |
|
Increase of 5–7.5% |
12.3 |
14.1 |
2.9 |
13.2 |
|
Increase of 7.5–10% |
5.5 |
9.9 |
0.0 |
4.4 |
|
Increase of 10% or more |
11.0 |
8.5 |
7.4 |
19.1 |
|
Median Expected Change |
3–4% |
1–2% |
0% |
4–5% |
|
**Percentages may not sum to 100 because of rounding. |
Summary of Returns (July 2021)