Manufacturing activity in the region declined overall in September, according to the firms responding to this month's Manufacturing Business Outlook Survey. The indicator for current activity returned to negative territory, the new orders index remained negative, and the shipments index also declined but remained positive. The firms reported continued increases in employment. The price indexes continue to indicate increases in prices overall. Expectations for growth over the next six months were subdued, as the future general activity index improved but remained negative.
Current Indicators Weaken
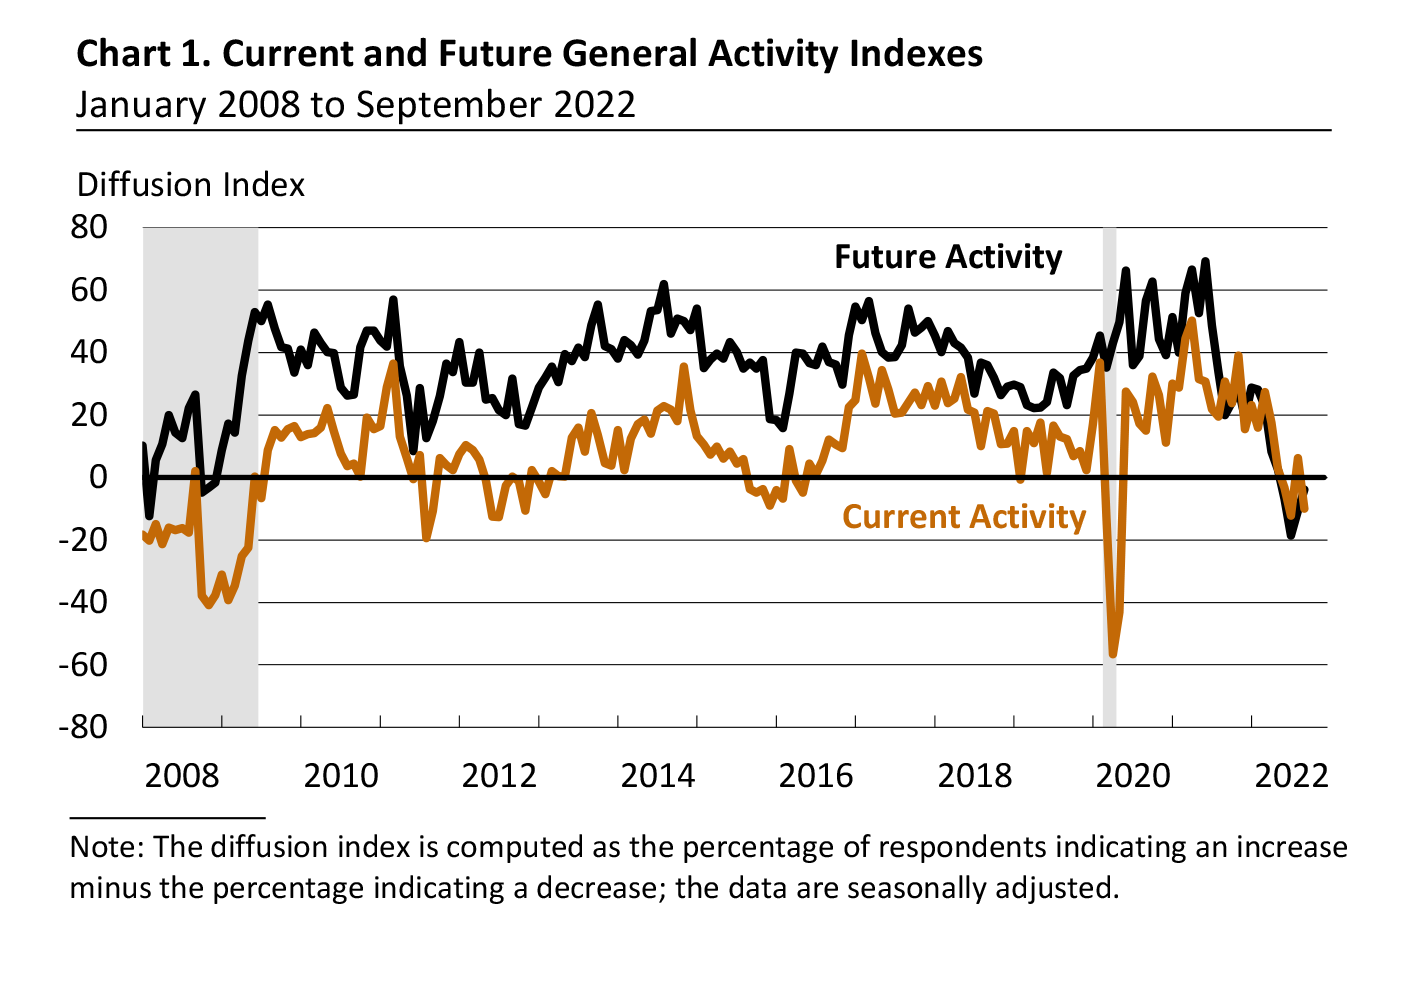
The diffusion index for current general activity returned to negative territory, falling from 6.2 in August to -9.9 this month (see Chart 1). This is the index's third negative reading in the past four months. Although most firms reported no change in activity (69 percent), the share of firms reporting decreases (20 percent) exceeded the share reporting increases (10 percent). The indicators for new orders and shipments also declined: The new orders index fell 13 points to -17.6, and the shipments index fell 16 points to its lowest reading since May 2020 but remained positive at 8.8.
On balance, the firms continued to report increases in employment, but the employment index declined from 24.1 to 12.0. Nearly 15 percent of the firms reported increases in employment, compared with 3 percent that reported decreases; 83 percent reported no change. The average workweek index decreased 10 points to -3.8, its first negative reading since June 2020.
Firms Continue to Report Overall Increases in Prices
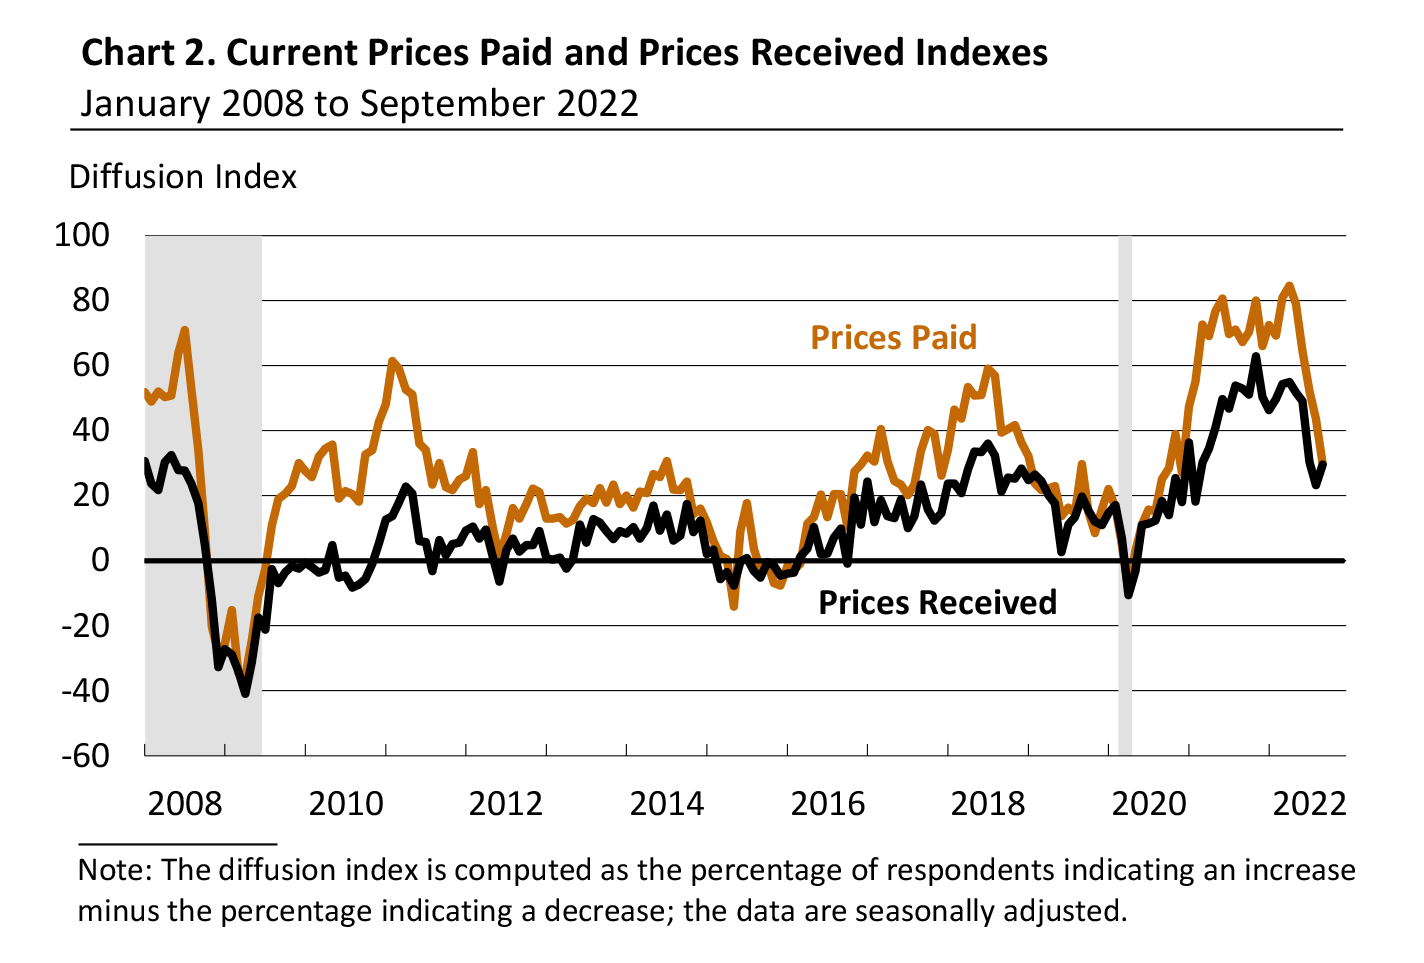
The indicators for prices paid and prices received remained positive but indicate less widespread increases in prices compared with previous months. The prices paid index declined for the fifth consecutive month, down 14 points to 29.8, its lowest reading since December 2020 and near its long-run nonrecession average (see Chart 2). Almost 41 percent of the firms reported increases in input prices, while 11 percent reported decreases; 48 percent of the firms reported no change. The current prices received index moved up 6 points to 29.6. Nearly 34 percent of the firms reported increases in prices received for their own goods this month, 4 percent reported decreases, and 62 percent reported no change.
Firms Report Higher Production, Steady Capacity Utilization
In this month's special questions, the firms were asked to estimate their total production growth for the third quarter ending this month compared with the second quarter of 2022. The share of firms reporting expected increases in third-quarter production (56 percent) exceeded the share reporting decreases (22 percent). The firms were also asked about their current capacity utilization rate for the current quarter and one year ago as well as factors constraining capacity utilization in the current quarter. The median current capacity utilization rate reported among the responding firms was 70 to 80 percent, the same as what was reported for one year ago.
Regarding factors constraining capacity utilization in the current quarter, nearly all firms reported labor supply and supply chains as constraints to some degree, with comparable shares indicating each factor significantly constrained utilization (37 percent and 34 percent, respectively). Looking ahead over the next three months, 27 percent of the firms expect supply chain impacts to improve, 54 percent expect them to stay the same, and 20 percent expect them to worsen.
Future Indicators Remain Low
The diffusion index for future general activity rose 7 points but remained negative at -3.9, its fourth consecutive negative reading (see Chart 1). The share of firms expecting decreases in activity (30 percent) slightly exceeded the share of firms expecting increases (26 percent); 37 percent expect no change. The future new orders index recorded its first positive reading since May, rising 14 points to 6.0, and the future shipments index increased from 12.0 to 20.6. The firms continued to expect overall increases in employment over the next six months, but the future employment index ticked down 3 points to 22.4. About one-third of the firms expect to increase employment in their manufacturing plants over the next six months; 11 percent anticipate employment declines. The future capital expenditures index fell from 18.0 to 4.6, offsetting its increase from last month.
Summary
Responses to the September Manufacturing Business Outlook Survey suggest overall declines for the region's manufacturing sector. The survey's indicators for general activity, new orders, and shipments all declined, with the former two registering negative readings. The indicator for employment declined but continues to suggest overall increases. The firms reported price increases overall; however, the price indexes suggest prices are less widespread than in the previous month. The survey's broad indicators for future activity improved but indicate subdued expectations for overall growth over the next six months.
Special Questions (September 2022)
1. How will your firm's total production for the third quarter of 2022
compare with that of the second quarter of 2022?
| An increase of: |
% of firms |
Subtotals |
| 10% or more |
7.3 |
% of firms reporting an increase: 56.1 |
| 5-10% |
24.4 |
| 0-5% |
24.4 |
| No change |
22.0 |
|
| A decline of: |
|
|
| 0-5% |
14.6 |
% of firms reporting a decrease: 21.9 |
| 5-10% |
2.4 |
| 10% or more |
4.9 |
2. Which of the following best characterizes your plant's percentage capacity utilization currently
(2022:Q3) and one year ago (2021:Q3)?
Capacity Utilization Rate |
2022:Q3
% of Reporters |
2021:Q3
% of Reporters |
| Less than 30% |
0.0 |
0.0 |
| 30-40% |
0.0 |
0.0 |
| 40-50% |
0.0 |
2.5 |
| 50-60% |
4.9 |
15.0 |
| 60-70% |
17.1 |
17.5 |
| 70-80% |
51.2 |
30.0 |
| 80-90% |
12.2 |
22.5 |
| 90-100% |
14.6 |
12.5 |
| Median Utilization Rate |
70-80 |
70-80 |
3. In the current quarter, to what degree have the following factors acted as constraints on capacity utilization?
| |
Not at all
(%)
|
Slightly
(%)
|
Moderately
(%) |
Significantly
(%) |
| COVID-19 mitigation measures |
70.7 |
26.8 |
2.4 |
0.0 |
| Energy markets |
52.5 |
20.0 |
22.5 |
5.0 |
| Financial capital
|
95.0 |
2.5 |
2.5 |
0.0 |
|
Labor supply
|
9.8 |
24.4 |
29.3 |
36.6 |
| Supply chains |
2.4 |
29.3 |
34.1 |
34.1 |
| Other factors |
76.5 |
11.8 |
11.8 |
0.0 |
4. Over the next three months, how do you expect the impacts of the following factors as constraints on capacity utilization to change?
| |
Worsen
(%)
|
Stay the same
(%)
|
Improve
(%)
|
| COVID-19 mitigation measures |
10.5 |
73.7 |
15.8 |
| Energy markets |
27.5 |
70.0 |
2.5 |
|
Financial capital
|
7.5 |
90.0 |
2.5 |
|
Labor supply
|
19.5 |
61.0 |
19.5 |
| Supply chains |
19.5 |
53.7 |
26.8 |
| Other factors |
4.8 |
90.5 |
4.8 |