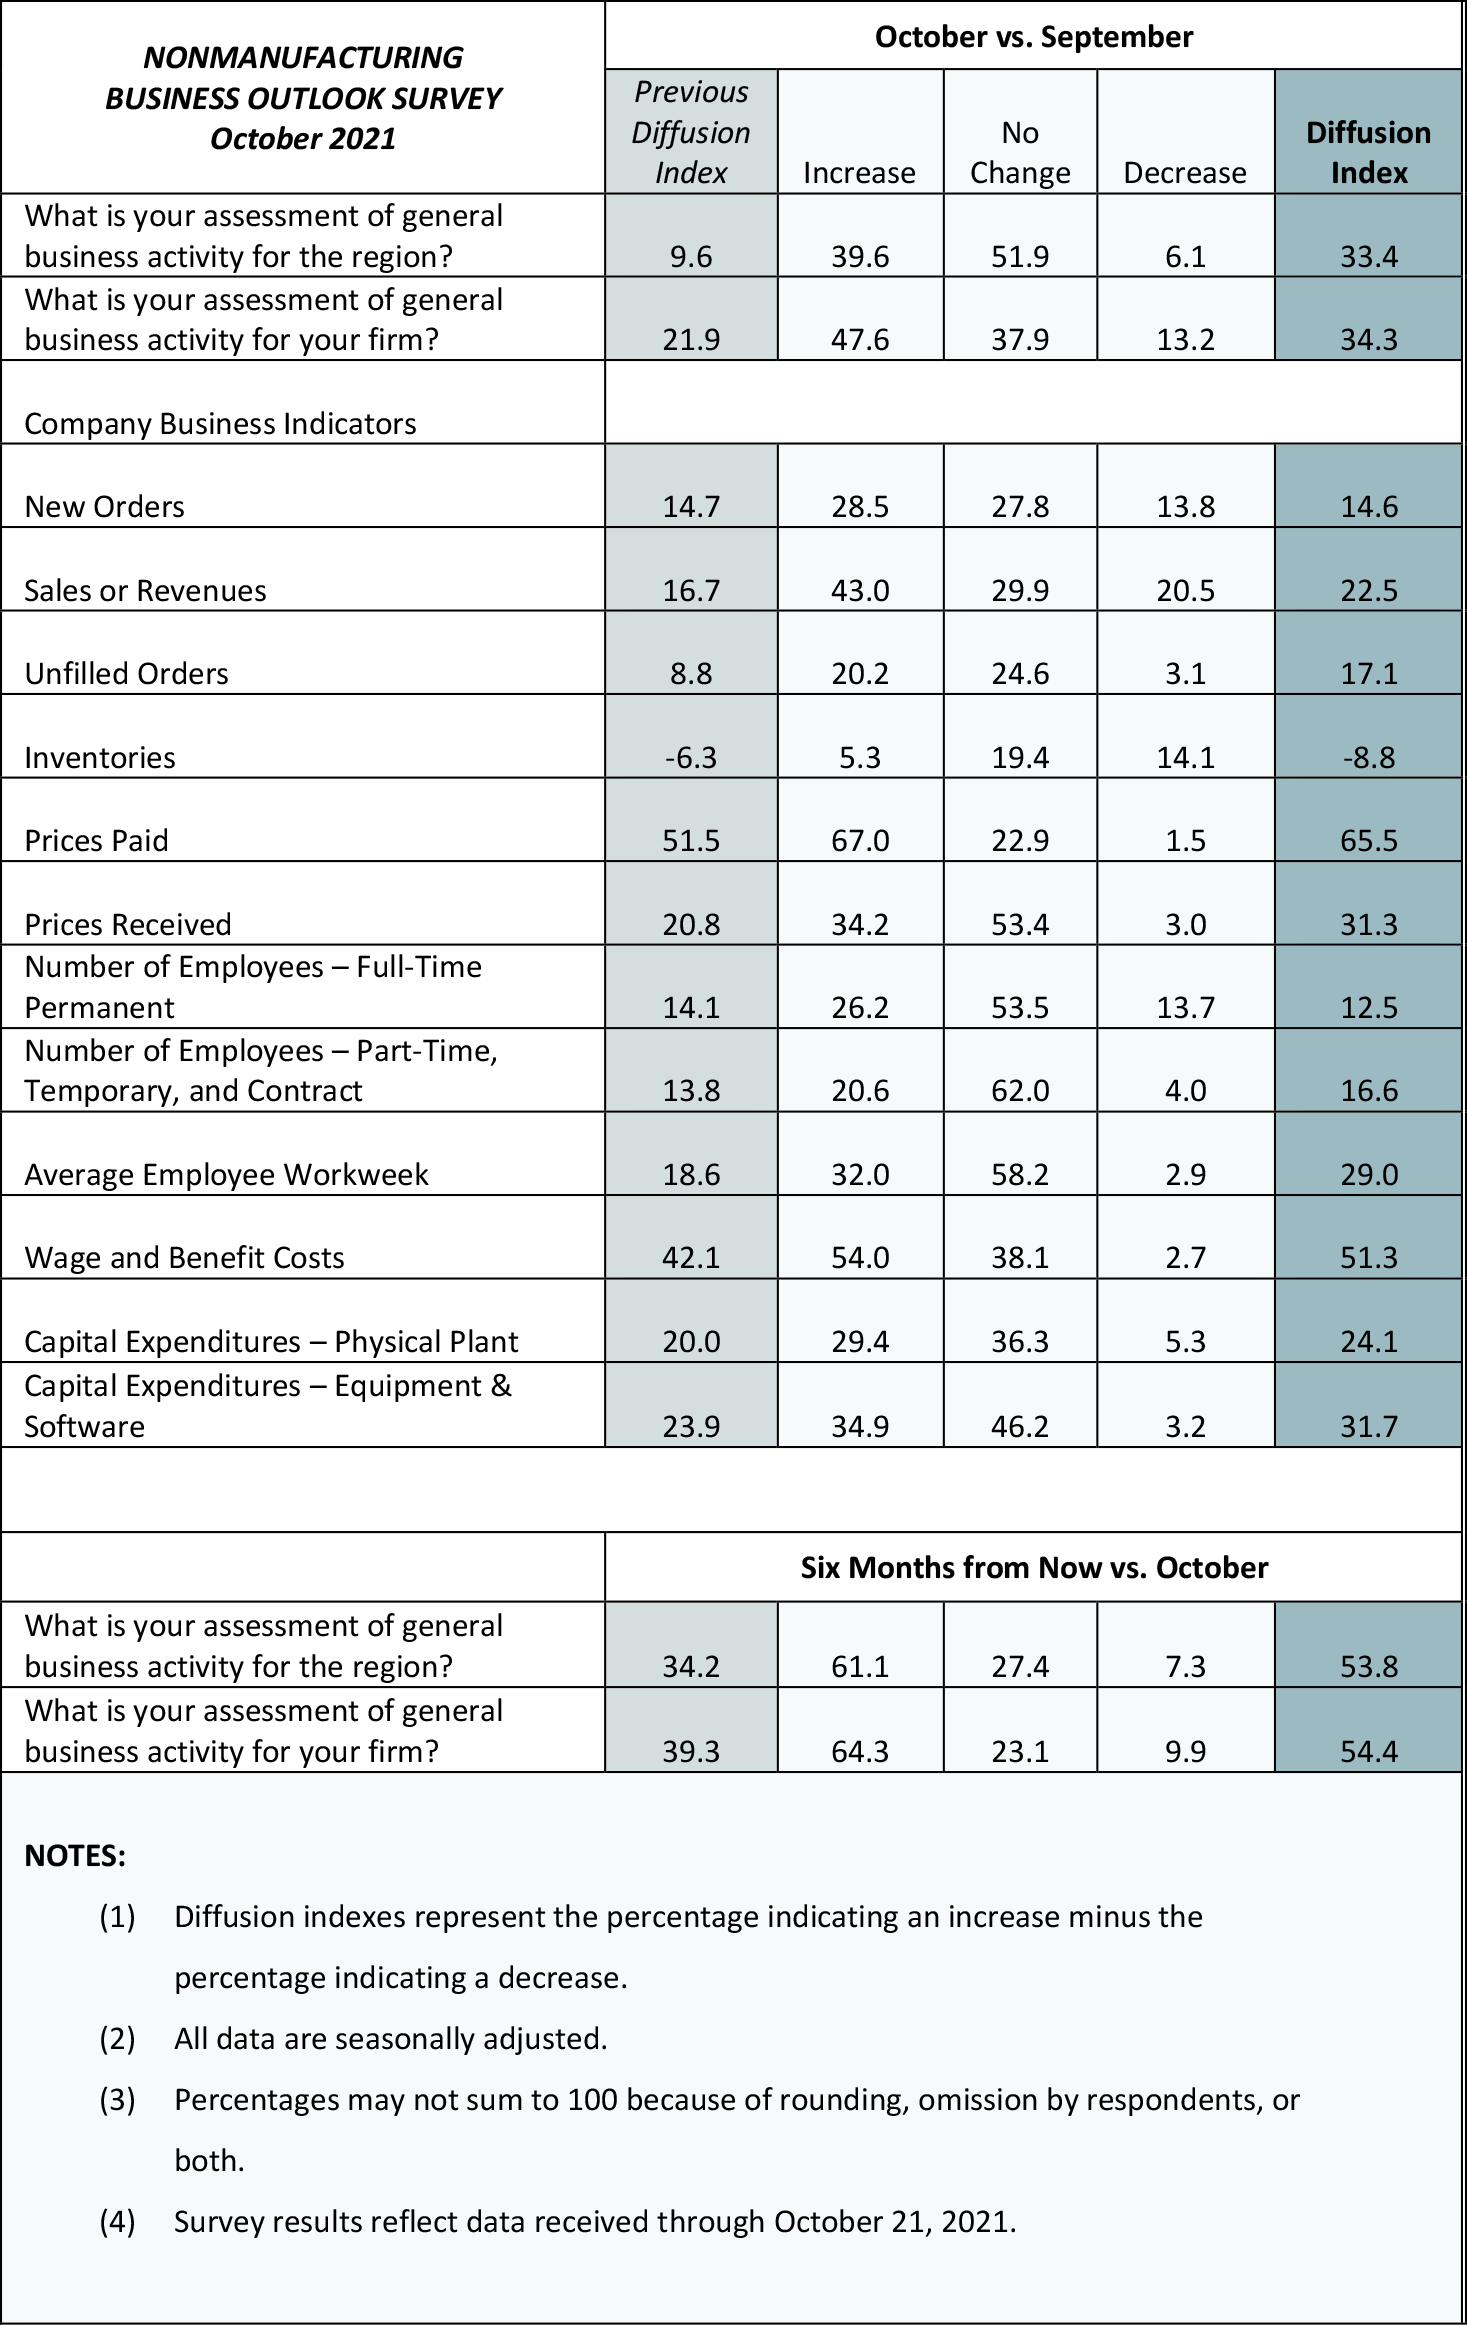
Nonmanufacturing activity in the region continued to expand this month, according to the firms responding to the Nonmanufacturing Business Outlook Survey. The survey's current indicators for general activity and sales/revenues increased, while the index for new orders remained steady. The survey's indexes for prices paid and prices received both reached all-time highs this month. The respondents expect overall improvement in conditions over the next six months.
Firms Report Continued Growth
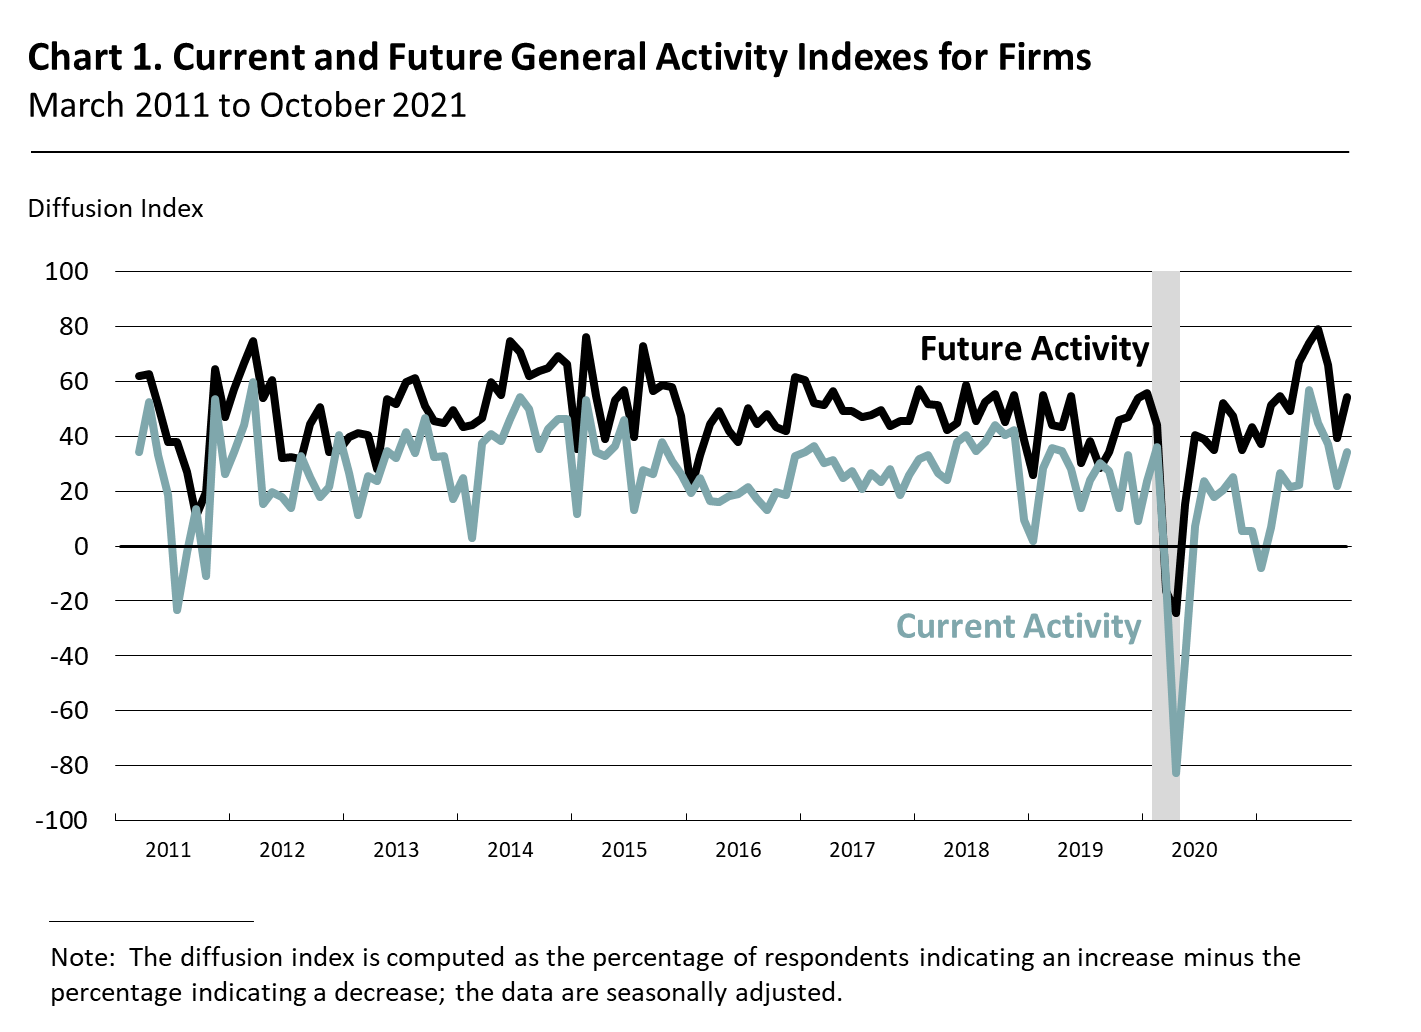
The diffusion index for current general activity at the firm level rose 12 points to 34.3 in October after falling 15 points last month (see Chart 1). Almost 48 percent of the firms reported increases, while 13 percent reported decreases. The new orders index remained mostly unchanged at 14.6 in October. Nearly 29 percent of the firms reported increases in new orders, exceeding the 14 percent that reported decreases. The sales/revenues index rose 6 points to 22.5 this month. Forty-three percent of the firms reported increases in sales/revenues, while 21 percent reported decreases. The regional activity index mostly recovered from its decline last month, rising 24 points to 33.4.
Employment Indexes Remain Positive
The firms reported overall increases in full-time and part-time employment. The full-time employment index was positive at 12.5 despite a 2 point drop this month. The share of firms reporting increases in full-time employment (26 percent) exceeded the share reporting decreases (14 percent); the majority (54 percent) reported no change. The part-time employment index increased 3 points to 16.6. Most firms reported steady part-time employment (62 percent), while 21 percent of the firms reported increases and 4 percent reported decreases. The wages and benefits indicator rose 9 points to 51.3, and the average workweek index rose 10 points to 29.0.
Firms Continue to Report Overall Price Increases
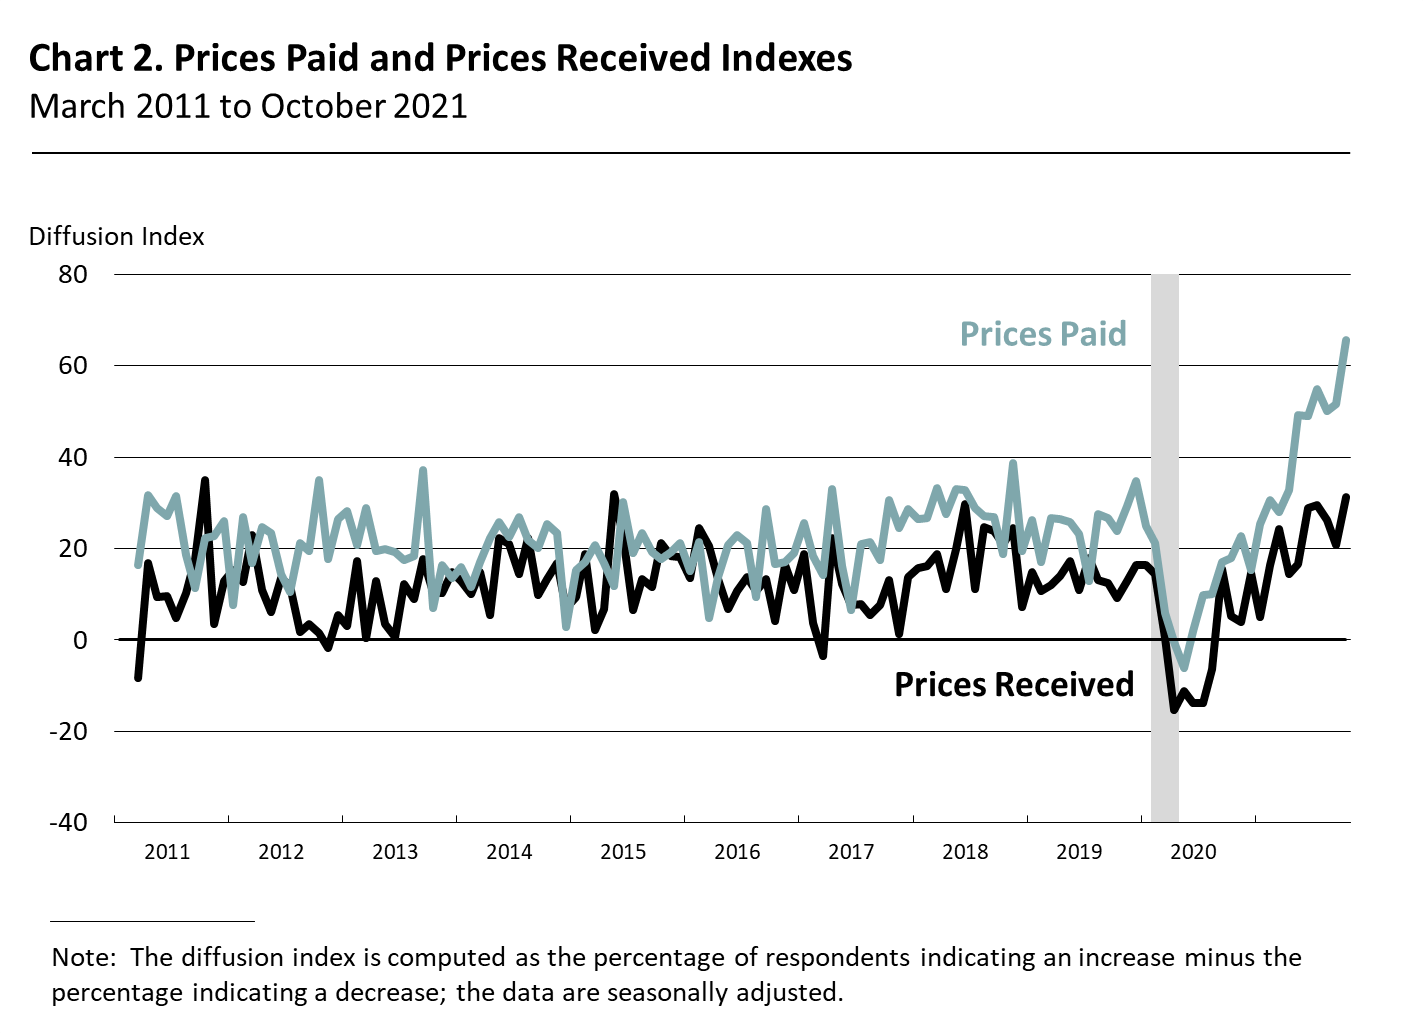
Price indicator readings suggest overall increases in prices for inputs and prices for the firms' own goods and services, as both indexes reached all-time highs this month. The prices paid index increased 14 points to 65.5 in October (see Chart 2). Sixty-seven percent of the firms reported increases in prices paid, 23 percent of the firms reported steady input prices, and only 2 percent of the firms reported decreases. Regarding prices for the firms' own goods and services, the prices received index increased 11 points to 31.3. Most firms (53 percent) reported no change in prices received, while 34 percent reported increases, and 3 percent reported decreases.
Firms Anticipate Higher Capital Expenditures Next Year
For this month's special question, nonmanufacturers were asked about their plans for different categories of capital spending for the upcoming year (see Special Question). Identical shares of firms (41 percent) expect either to increase total capital spending or keep it unchanged in 2022; 18 percent expect to spend less on capital spending. On balance, the firms expect higher capital spending in all categories (software, noncomputer equipment, energy-saving investments, computer and related hardware, structure, and other). More than 49 percent of the responding firms expect higher spending on software, and 43 percent expect higher spending on computer and related hardware.
Firms Anticipate Continued Growth
Both future activity indexes suggest continued optimism about growth over the next six months. The diffusion index for future activity at the firm level increased 15 points to a reading of 54.4 this month (see Chart 1). More than 64 percent of the firms expect an increase in activity at their firms over the next six months compared with 10 percent that expect decreases. The future regional activity index increased 20 points to 53.8 in October.
Summary
Responses to this month's Nonmanufacturing Business Outlook Survey suggest continued expansion in nonmanufacturing activity in the region. The indicators for firm-level general activity and sales/revenues increased, while the index for full-time employment held steady. Both the prices paid and prices received indexes reached all-time highs this month. The future activity indexes suggest that respondents expect improvement at their firms and in the region over the next six months.
Special Question (October 2021)
| Comparing 2022 with 2021, do you expect capital expenditures to be higher, the same, or lower for each of the following categories? |
| |
Higher
(% of reporters)
|
Same
(% of reporters)
|
Lower
(% of reporters)
|
Diffusion
Index |
| Software |
49.4 |
40.7 |
9.9 |
39.5 |
| Noncomputer equipment |
26.3 |
61.8 |
11.8 |
14.5 |
|
Energy-saving investments
|
22.1 |
69.1 |
8.8 |
13.2 |
|
Computer & related hardware
|
43.0 |
50.6 |
6.3 |
36.7 |
| Structure |
23.5 |
69.1 |
7.4 |
16.2 |
| Other |
15.8 |
78.9 |
5.3 |
10.5 |
|
Total capital spending |
41.3 |
41.3 |
17.5 |
23.8 |
Summary of Returns (October 2021)