Manufacturing activity in the region declined overall in July, according to the firms responding to this month's Manufacturing Business Outlook Survey. The survey's indicators for current general activity and new orders declined further into negative territory. The shipments index was positive and rose slightly, while the indexes for inventories and unfilled orders were negative. The employment indicators declined but remained positive. Both price indexes fell but remain elevated. The future indicators suggest that firms expect overall declines in activity and new orders but increases in shipments and employment over the next six months.
Most Current Indicators Decline
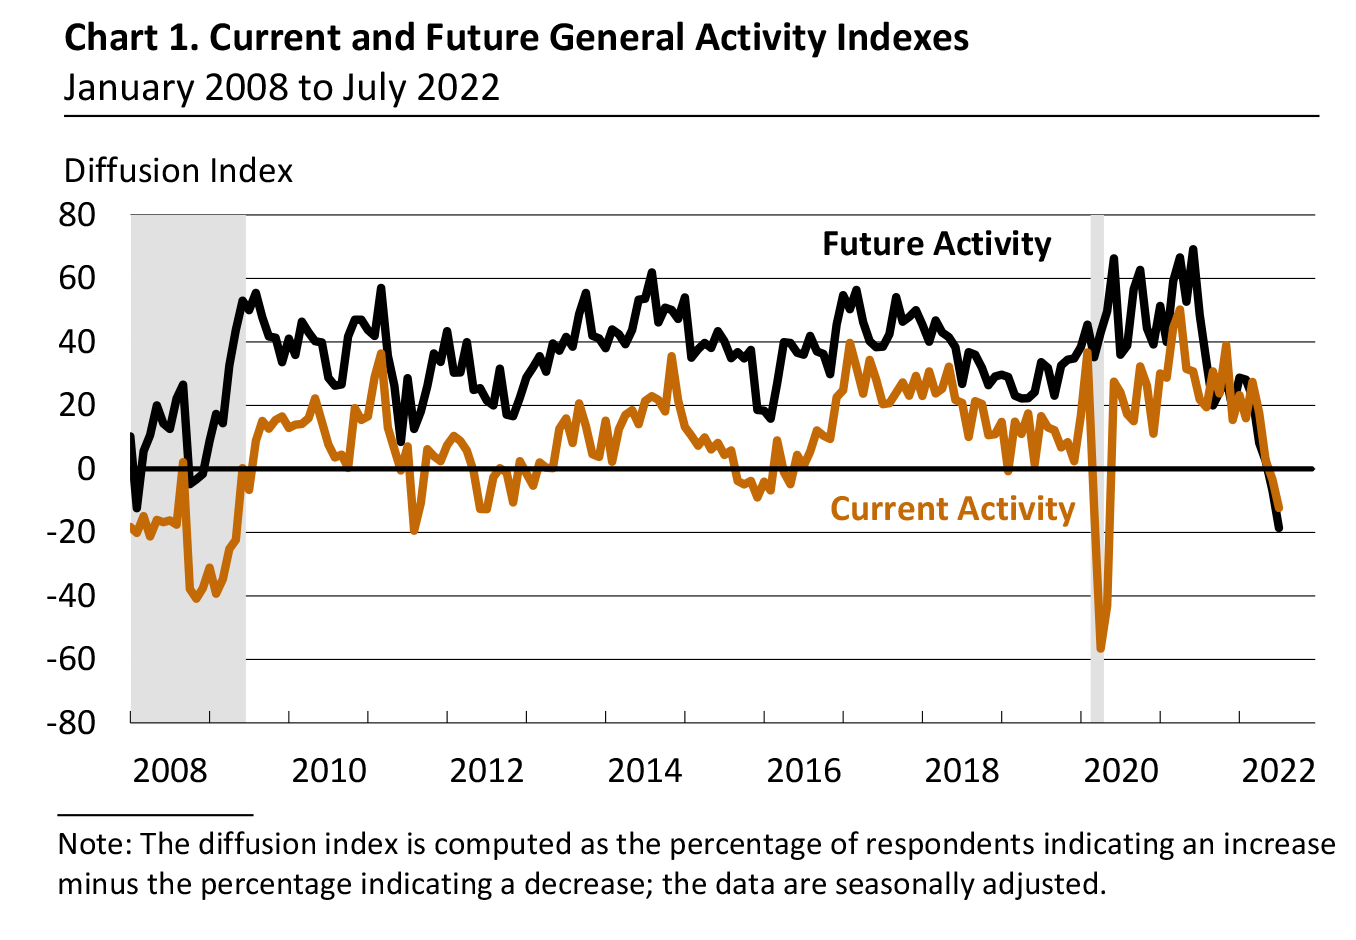
The diffusion index for current general activity decreased for the fourth consecutive month, falling 9 points to -12.3 in July (see Chart 1). Although most firms reported no change in activity (61 percent), the share of firms reporting decreases (24 percent) exceeded the share of firms reporting increases (12 percent). The index for new orders declined for the second consecutive month, from -12.4 to -24.8. However, the current shipments index rose from 10.8 to 14.8. The indexes for current inventories and unfilled orders were negative, at -9.3 and -10.4, respectively.
On balance, the firms continued to report increases in employment, but the employment index declined 9 points to 19.4, its lowest reading since May 2021. Nearly 24 percent of the firms reported employment increases, while 4 percent reported decreases; 72 percent reported no change in employment levels. The average workweek index decreased for the fourth consecutive month, to 6.4.
Price Increases Remain Widespread
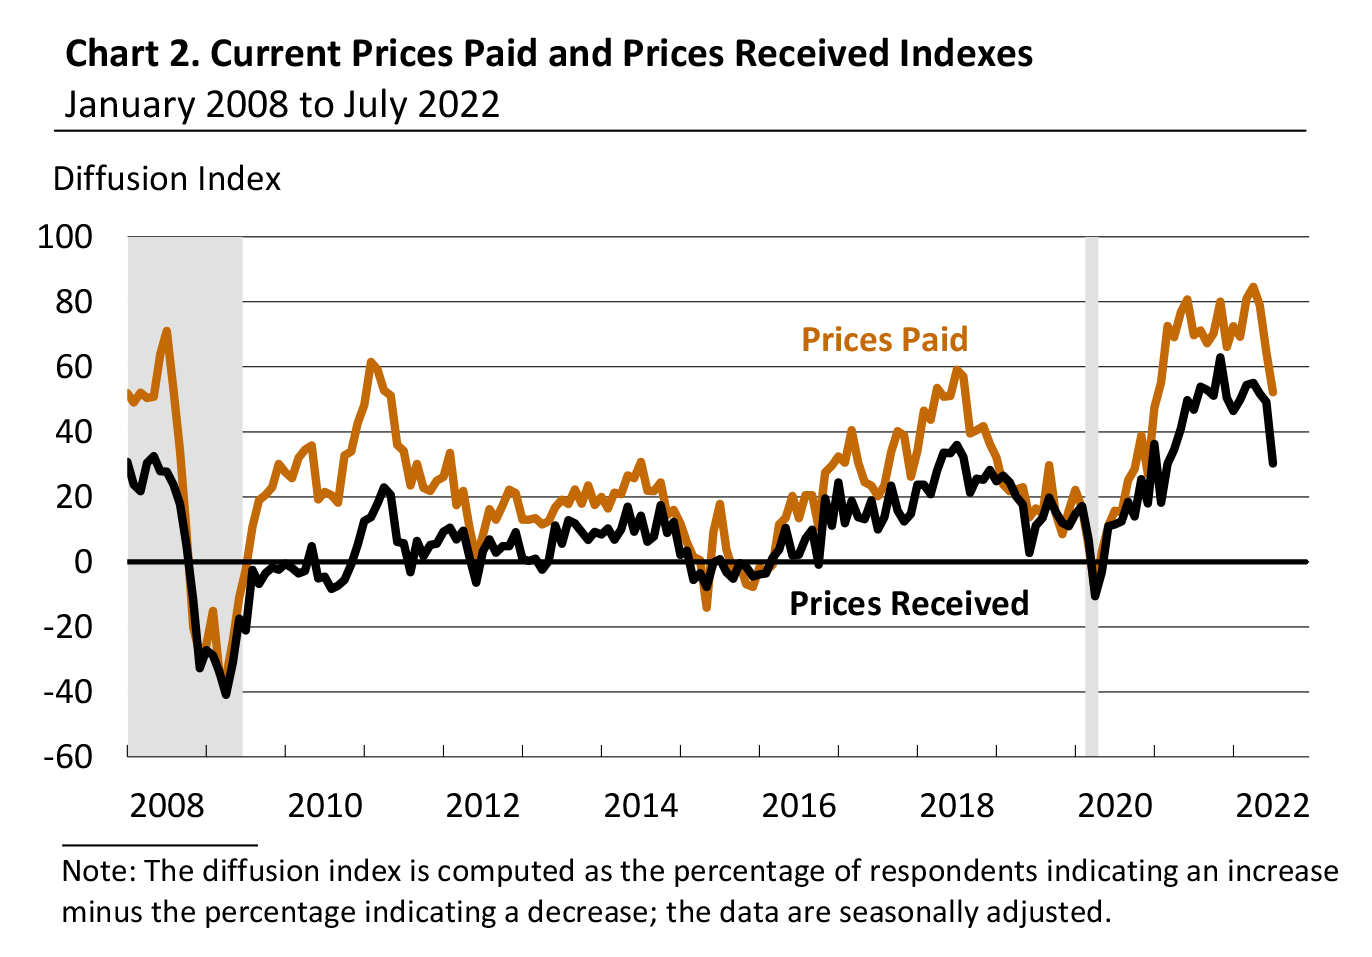
The indicators for prices paid and prices received declined for the third consecutive month but continued to suggest widespread price increases. The prices paid index fell 12 points to 52.2, its lowest reading since January 2021 (see Chart 2). Nearly 56 percent of the firms reported increases in input prices, while 3 percent reported decreases; 40 percent of the firms reported no change. The current prices received index dropped 19 points to 30.3. Almost 37 percent of the firms reported increases in prices received for their own goods this month, 6 percent reported decreases, and 57 percent reported no change.
Firms Expect Highest Increases for Energy, Raw Materials
In this month's special questions, the firms were asked about changes in wages and compensation over the past three months as well as their updated expectations for changes in various input and labor costs for the current year. Nearly 79 percent of the firms indicated wages and compensation costs had increased over the past three months, 21 percent reported no change, and none reported decreases. Most firms have reported adjusting their 2022 budgets for wages and compensation since the beginning of the year, with 57 percent noting they are planning to increase wages and compensation by more than originally planned and 14 percent noting they are planning to increase wages and compensation sooner than originally planned.
The firms still expect higher costs across all categories of expenses in 2022, but median expected increases were unchanged or lower than when this question was last asked in April for most categories. Responses indicate a median expected increase of 7.5 to 10 percent for energy and for raw materials and of 5 to 7.5 percent for intermediate goods, health benefits, and total compensation (wages plus benefits).
Future Indicators Remain Weak
The diffusion index for future general activity decreased 12 points to -18.6, its lowest reading since December 1979 (see Chart 1). More than 35 percent of the firms expect decreases in future activity (down from 42 percent last month), compared with 17 percent that expect increases (down from 36 percent); 40 percent of the firms expect no change in future activity (up from 19 percent last month). The future new orders index declined 5 points to -12.4, while the future shipments index rose 9 points to 12.8. The future employment index rose 6 points to 16.5. Nearly 56 percent of the firms expect steady employment levels over the next six months, 29 percent of the firms expect to increase employment, and 13 percent expect employment declines. The future capital expenditures index fell 7 points to 4.4, its lowest reading since March 2013, as 81 percent of the firms expect no change in spending over the next six months and only 10 percent expect increases.
Summary
Responses to the July Manufacturing Business Outlook Survey suggest overall declines in regional manufacturing activity this month. The indicators for current activity and new orders remained negative, while the shipments index rose slightly. The firms continued to indicate overall increases in employment and widespread increases in prices. The indicators for future general activity and new orders remained negative, suggesting that respondents expect overall declines over the next six months.
Special Questions (July 2022)
1. How have wages and compensation changed at your firm over the past three months?
|
Percent (%) |
| Increased |
78.6 |
| No change |
21.4 |
| Decreased |
0.0 |
2. Since the beginning of the year, have you adjusted your budget for wages and compensation for 2022?*
|
Percent (%) |
| Yes, and we are planning to increase wages and compensation by more than originally planned. |
57.1 |
| Yes, and we are planning to increase wages and compensation sooner than originally planned. |
14.3 |
| No, we have not needed to make adjustments. |
31.0 |
| Other |
2.4 |
| *Percentages do not sum to 100 because more than one option could be selected. |
3. What percentage change in costs do you now expect for the following categories over all of 2022?**
| |
Energy
(%)
|
Other Raw Materials
(%)
|
Intermediate Goods
(%)
|
Wages
(%)
|
Health Benefits
(%)
|
Nonhealth Benefits
(%)
|
Wages + Health Benefits + Nonhealth Benefits (%) |
|
Decline of more than 1%
|
0.0 |
5.0 |
0.0 |
2.4 |
0.0 |
2.5 |
0.0 |
|
No change
|
7.5 |
2.5 |
6.5 |
4.9 |
15.0 |
22.5 |
5.1 |
|
Increase of 1–2%
|
5.0 |
0.0 |
3.2 |
0.0 |
2.5 |
10.0 |
2.6 |
|
Increase of 2–3%
|
0.0 |
5.0 |
6.5 |
9.8 |
5.0 |
12.5 |
2.6 |
|
Increase of 3–4%
|
5.0 |
0.0 |
9.7 |
12.2 |
10.0 |
12.5 |
10.3 |
|
Increase of 4–5%
|
15.0 |
5.0 |
12.9 |
22.0 |
15.0 |
15.0 |
15.4 |
|
Increase of 5–7.5%
|
5.0 |
20.0 |
35.5 |
22.0 |
15.0 |
10.0 |
17.9 |
|
Increase of 7.5–10%
|
15.0 |
12.5 |
16.1 |
12.2 |
20.0 |
10.0 |
23.1 |
|
Increase of 10–12.5%
|
17.5 |
12.5 |
3.2 |
9.8 |
12.5 |
2.5 |
12.8 |
|
Increase of more than 12.5%
|
2.5 |
17.5 |
3.2 |
2.4 |
2.5 |
0.0 |
2.6 |
|
Median Expected Change |
7.5–10% |
7.5–10% |
5–7.5% |
4–5% |
5–7.5% |
3–4% |
5–7.5% |
|
Median Expected Change (April 2022) |
7.5–10% |
10–12.5% |
7.5–10% |
4–5% |
4–5% |
2–3% |
5–7.5% |
| **The firms responded to more detailed changes than shown in the provided ranges. |