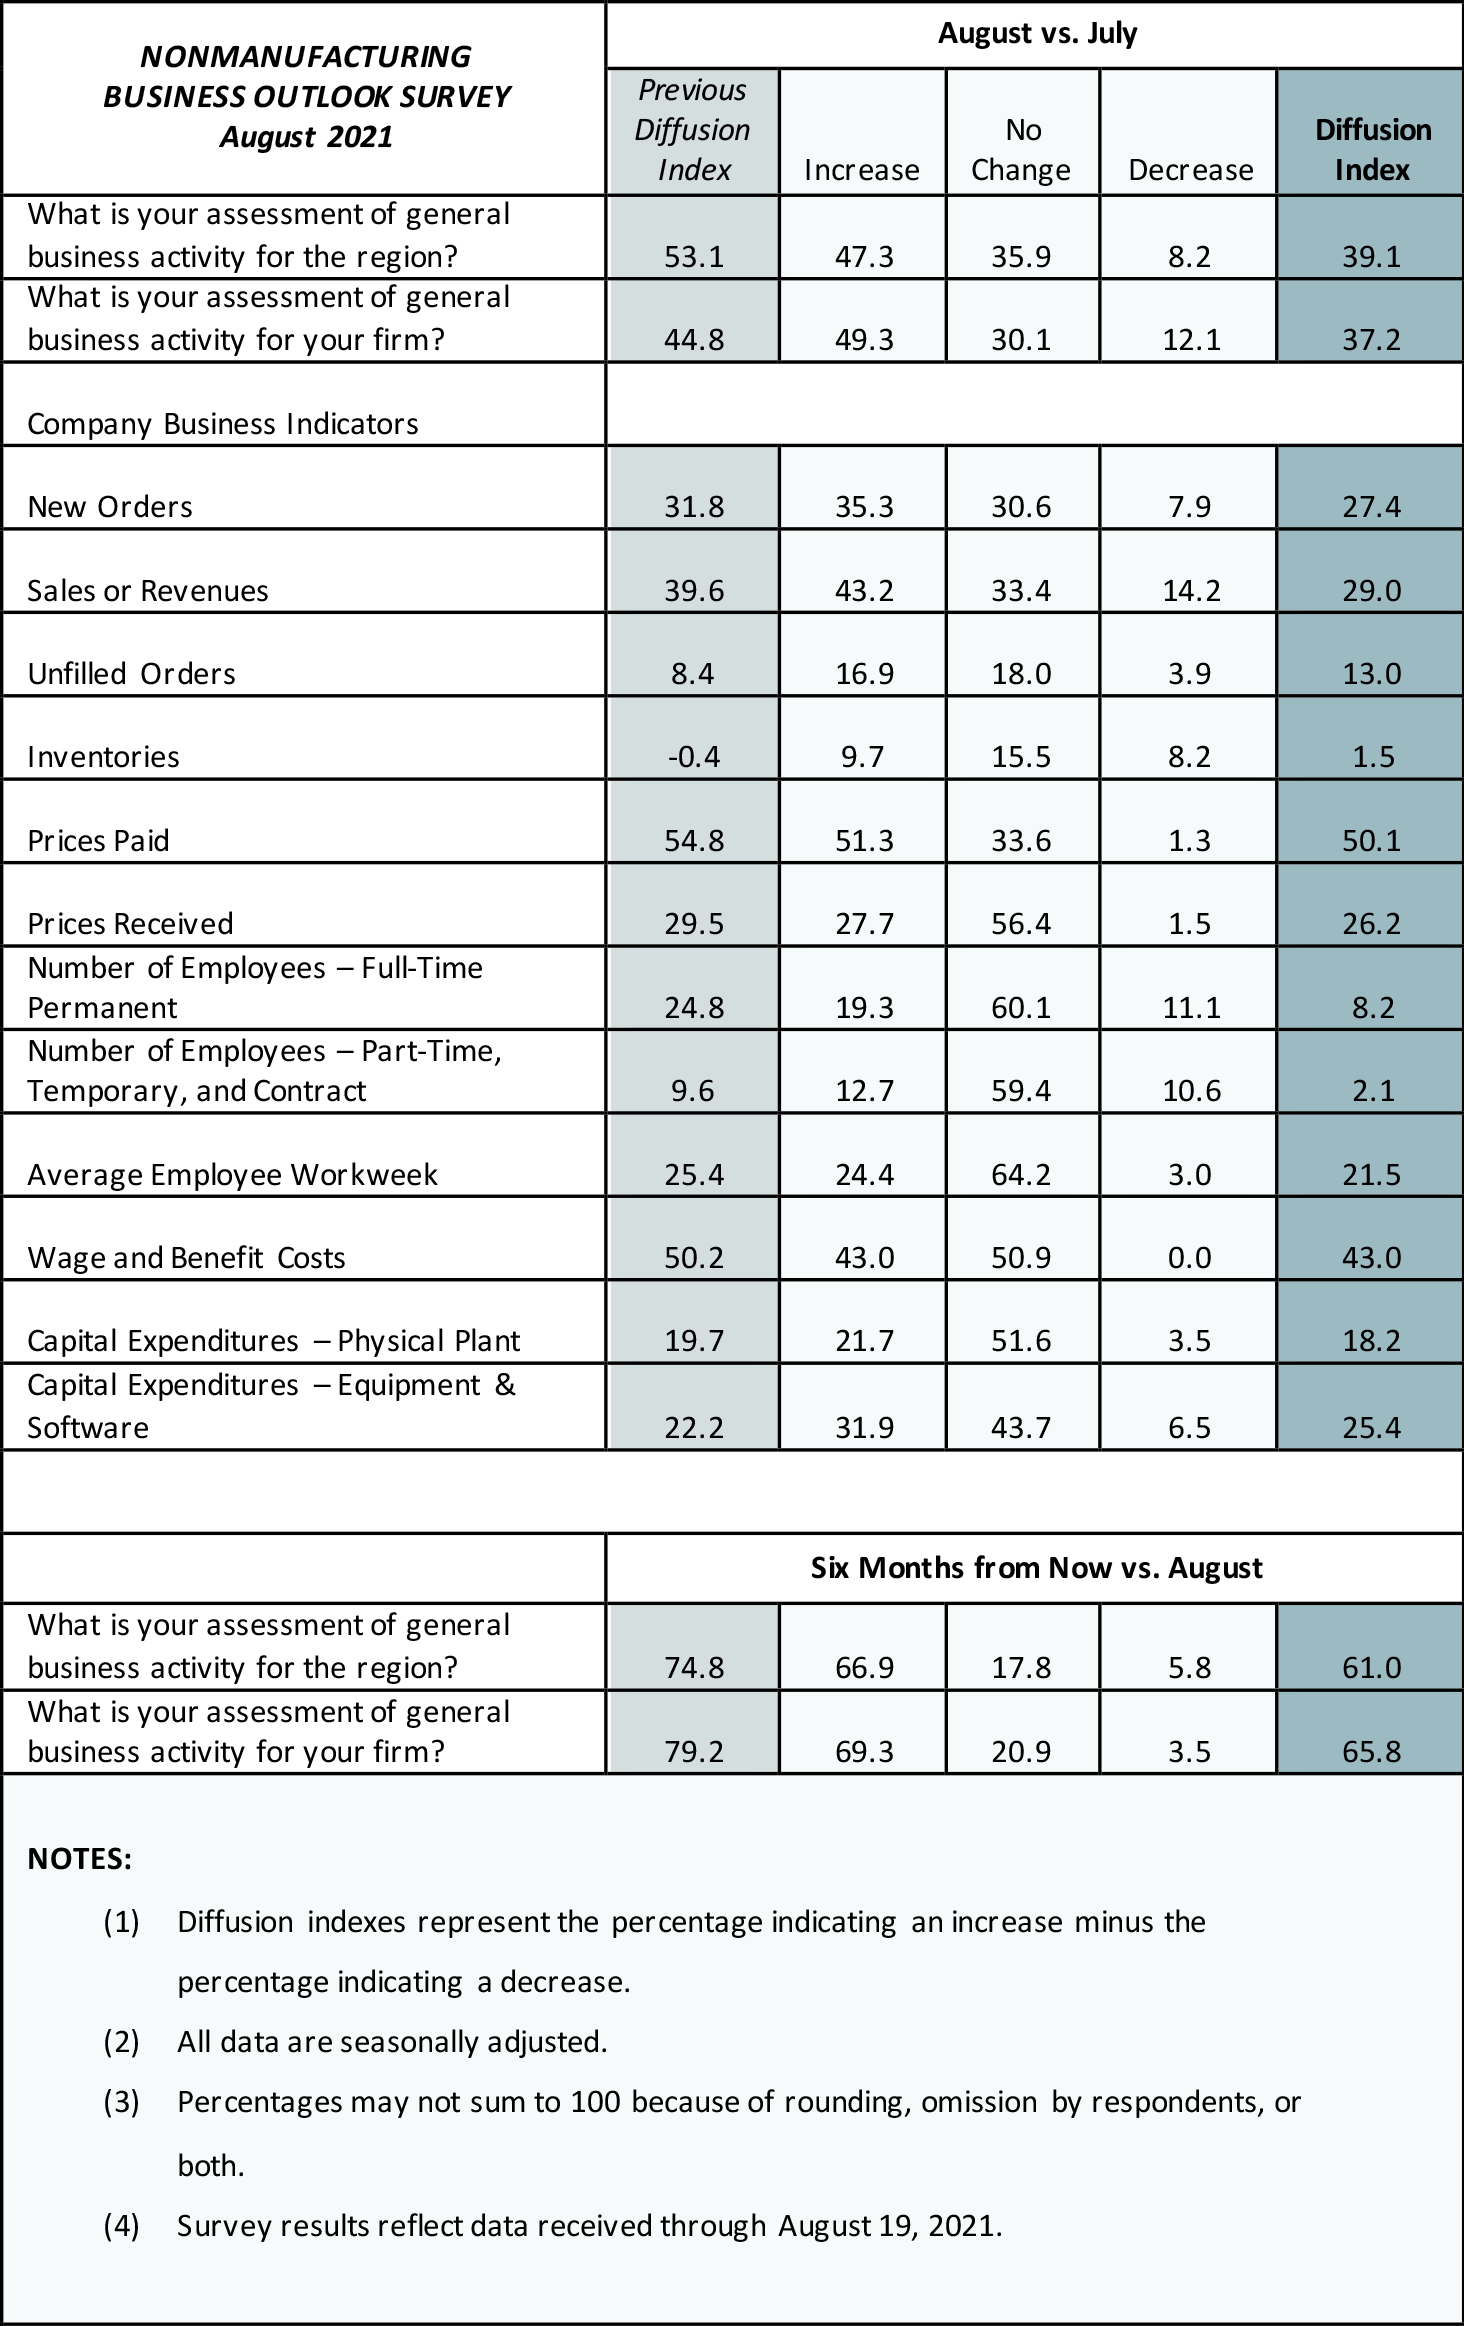
Responses to the August Nonmanufacturing Business Outlook Survey indicated continued growth in business activity in the region. The indexes for firm-level general activity, new orders, and sales/revenues remained positive but declined from their July readings. Further, the indexes for prices paid and prices received edged back, while the full-time employment index fell. The respondents expect overall improvement in conditions over the next six months.
Current Indicators Decline but Remain Elevated
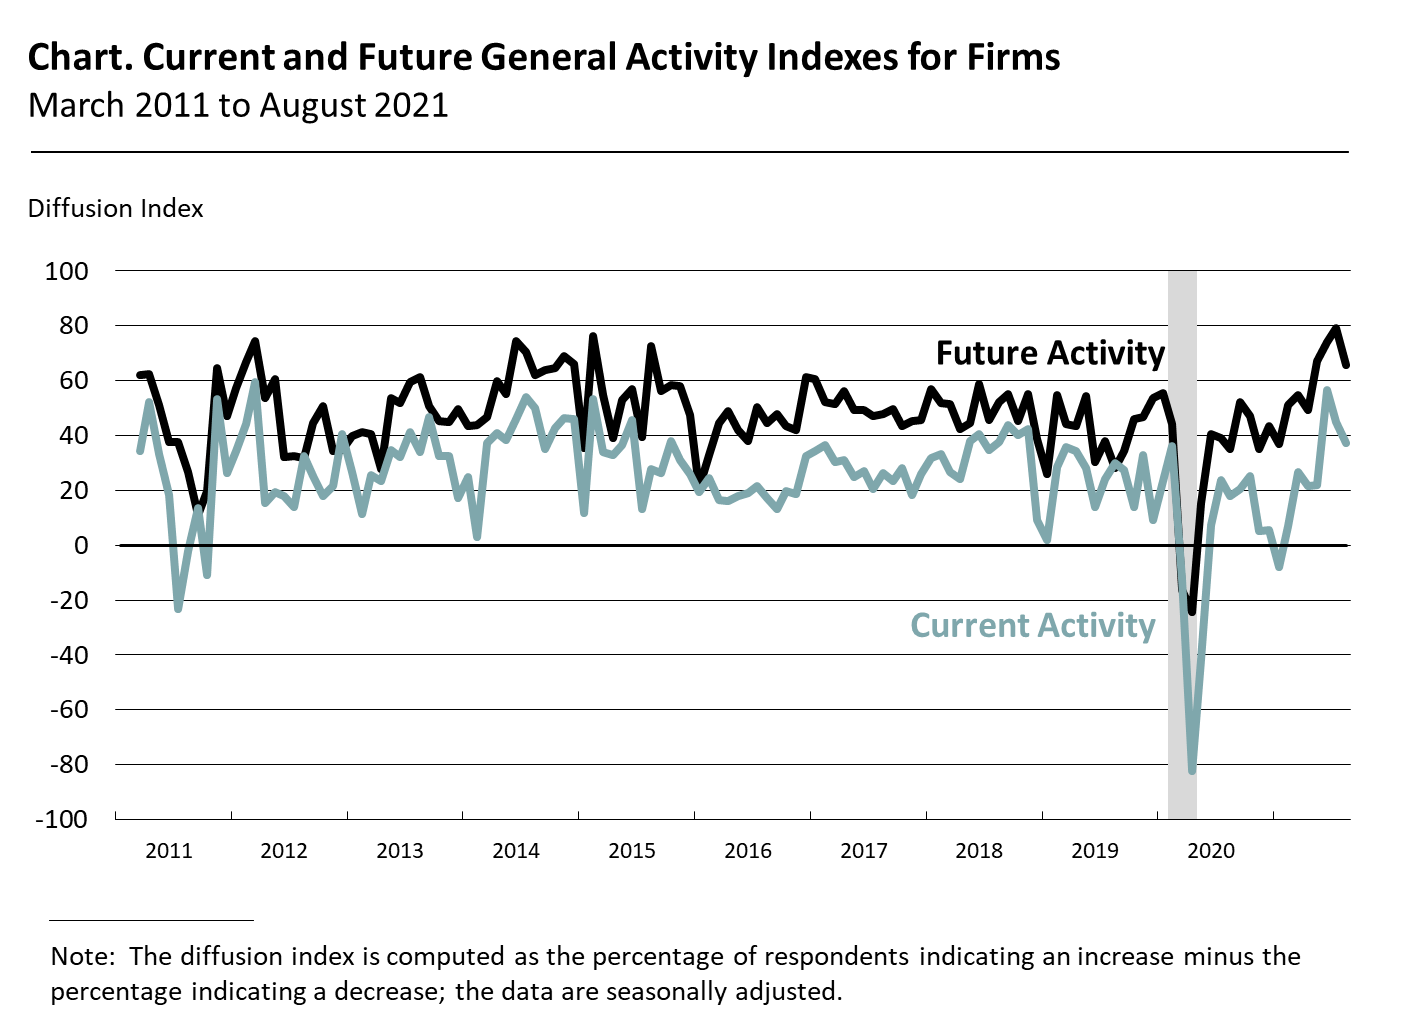
The diffusion index for current general activity at the firm level fell from 44.8 in July to 37.2 this month, its second consecutive decline after reaching its second-highest reading ever in June (see Chart). Over 49 percent of the firms reported increases in activity, while 12 percent reported decreases and 30 percent reported no change. The new orders index declined for the first time since April, falling 4 points to 27.4 in August. Over 35 percent of the firms reported increases in new orders, while 8 percent reported decreases. The sales/revenues index declined 11 points to 29.0, while the unfilled orders index increased 5 points to 13.0.
Most Firms Report Steady Employment
The full-time employment index, which has fluctuated over the past few months, fell 17 points to 8.2 after increasing 21 points in July. Just over 19 percent of the firms reported increases in full-time employment (down from 36 percent last month), while 11 percent reported decreases. Most respondents (60 percent) reported no change. The part-time employment index decreased 8 points to 2.1. Most firms reported steady part-time employment (59 percent), while 13 percent of the firms reported increases and 11 percent reported decreases. The average workweek index fell 4 points to 21.5.
Firms Continue to Report Overall Price Increases
Both the prices paid and prices received indexes declined this month but remain elevated. The prices paid index fell 5 points to 50.1. Most respondents (51 percent) reported increases in input prices, 33 percent of the firms reported no change, and 1 percent reported decreases. Regarding prices for the firms' own goods and services, the prices received index decreased 3 points to 26.2. Most respondents (56 percent) reported no change in prices received, while 28 percent reported increases and 2 percent reported decreases.
Firms Expect Own Prices to Rise Slower Than Inflation
In this month's special questions, the firms were asked to forecast the changes in the prices of their own products and services and for U.S. consumers over the next four quarters. Regarding their own prices, the firms' median forecast was for an increase of 3.8 percent, higher than the 3.0 percent increase reported in May. Regarding the firms' own price change over the previous year, the median response was 2.0 percent, up from 1.6 percent in May. When asked about the rate of inflation for U.S. consumers over the next year, the firms' median forecast was 4.5 percent, higher than the 4.0 percent recorded in May. The firms expect their employee compensation costs (wages plus benefits per employee) to rise 4.0 percent over the next four quarters, up from 3.0 percent in May. The firms' forecast for the long-run (10-year) inflation rate increased to 5.0 percent from 4.0 percent in May.
Future Indicators Remain Positive
Both future activity indexes suggest that the respondents expect overall improvement in nonmanufacturing activity over the next six months. The diffusion index for future activity at the firm level fell 13 points, from a historical high reading of 79.2 in July to 65.8 this month (see Chart). More than 69 percent of the firms expect an increase in activity at their firms over the next six months, compared with 21 percent that expect no change and 4 percent that expect decreases. The future regional activity index fell from 74.8 in July to 61.0 in August.
Summary
Responses to this month's Nonmanufacturing Business Outlook Survey reflect continued growth in nonmanufacturing activity in the region. The indicators for firm-level general activity, sales/revenues, and new orders declined but remained elevated. The indexes for both full-time and part-time employment also decreased. The future activity indexes continued to suggest that respondents expect improvement at their firms and in the region over the next six months.
Special Questions (August 2021)
|
Please list the annual percent change with respect to the following: |
|
Current
|
Previous
(May 2021)
|
|
For your firm:
|
|
Forecast for next year (2021Q3–2022Q3)
|
|
1. Prices your firm will receive (for its own goods and services sold).
|
3.8 |
3.0 |
|
2. Compensation your firm will pay per employee (for wages and benefits).
|
4.0
|
3.0
|
|
Last year's price change (2020Q3–2021Q3)
|
|
3. Prices your firm did receive (for its own goods and services sold) over the last year.
|
2.0 |
1.6 |
|
For U.S. consumers:
|
|
4. Prices U.S. consumers will pay for goods and services over the next year.
|
4.5 |
4.0 |
|
5. Prices U.S. consumers will pay for goods and services over the next 10 years (2021–2030).
|
5.0
|
4.0
|
|
The numbers represent medians of the individual forecasts (percent changes). For question 5, firms
reported a 10-year annual-average change.
|
Summary of Returns (August 2021)