Manufacturing activity in the region continued to decline overall in December, according to the firms responding to this month's Manufacturing Business Outlook Survey. The survey's broad indicators for current activity were all negative. The firms on balance also reported a decline in employment. The future indicators improved, suggesting that the firms expect overall growth over the next six months.
Current Indicators Suggest Declines
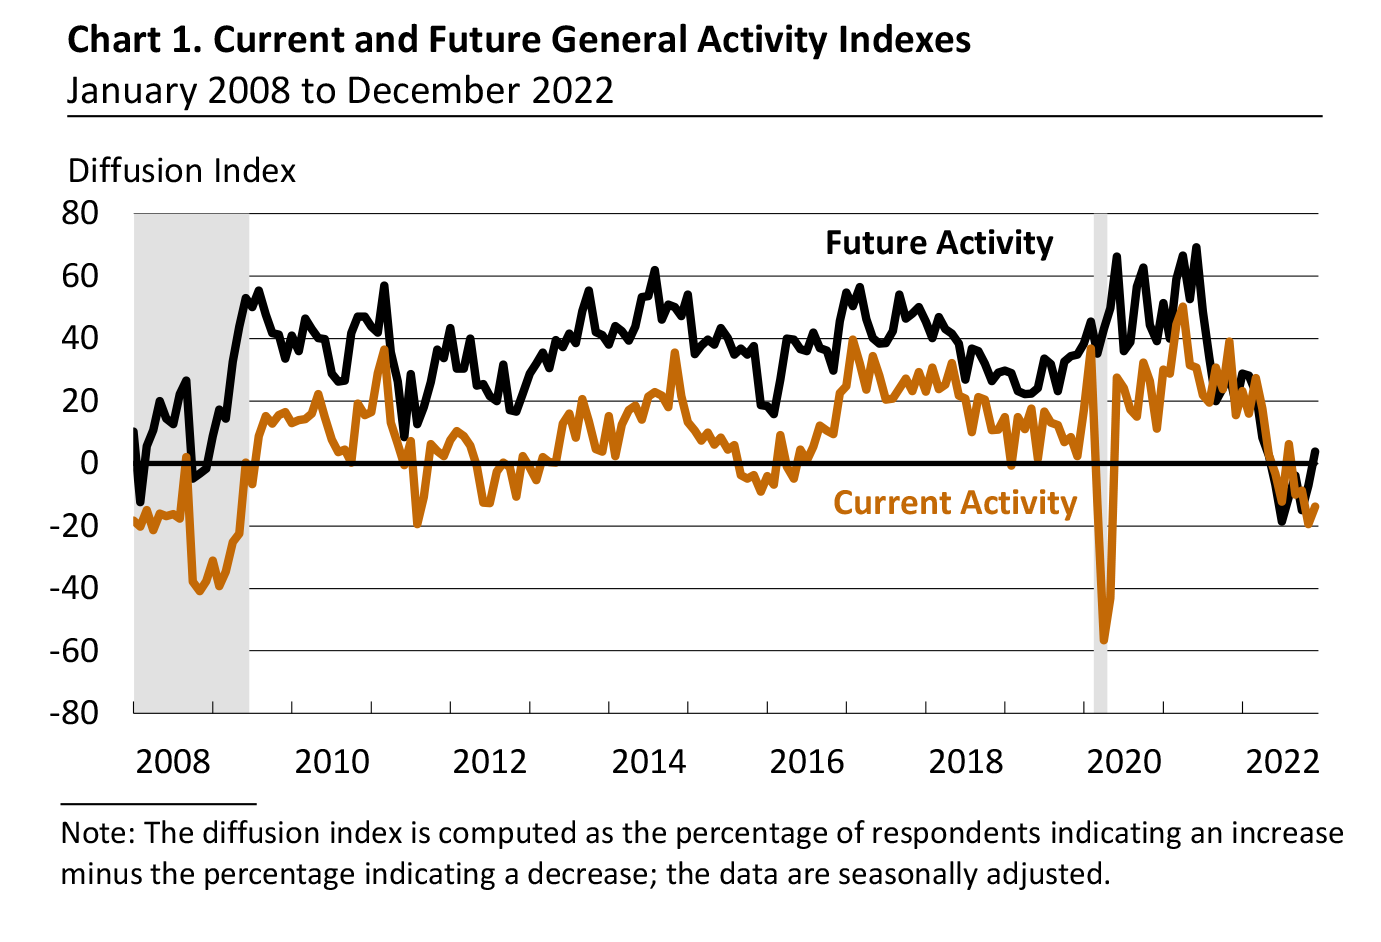
The diffusion index for current general activity remained negative but rose 6 points to -13.8 this month (see Chart 1). This is its fourth consecutive negative reading and sixth negative reading in the past seven months. Thirty-one percent of the firms reported declines in activity, while 17 percent reported increases. The majority (51 percent) reported no change. The indicators for new orders and shipments both declined: The new orders index decreased 9 points to -25.8, its lowest reading since April 2020, and the shipments index fell 13 points to -6.2, its first negative reading since May 2020.
On balance, the firms reported a decline in employment. The employment index dipped into negative territory for the first time since June 2020, falling from 7.1 in November to -1.8 this month. The 19 percent of firms reporting declines in employment narrowly exceeded the 17 percent that reported increases; 64 percent reported steady employment. The average workweek index also turned negative, falling 10 points to -8.9.
Price Increases Are Less Widespread
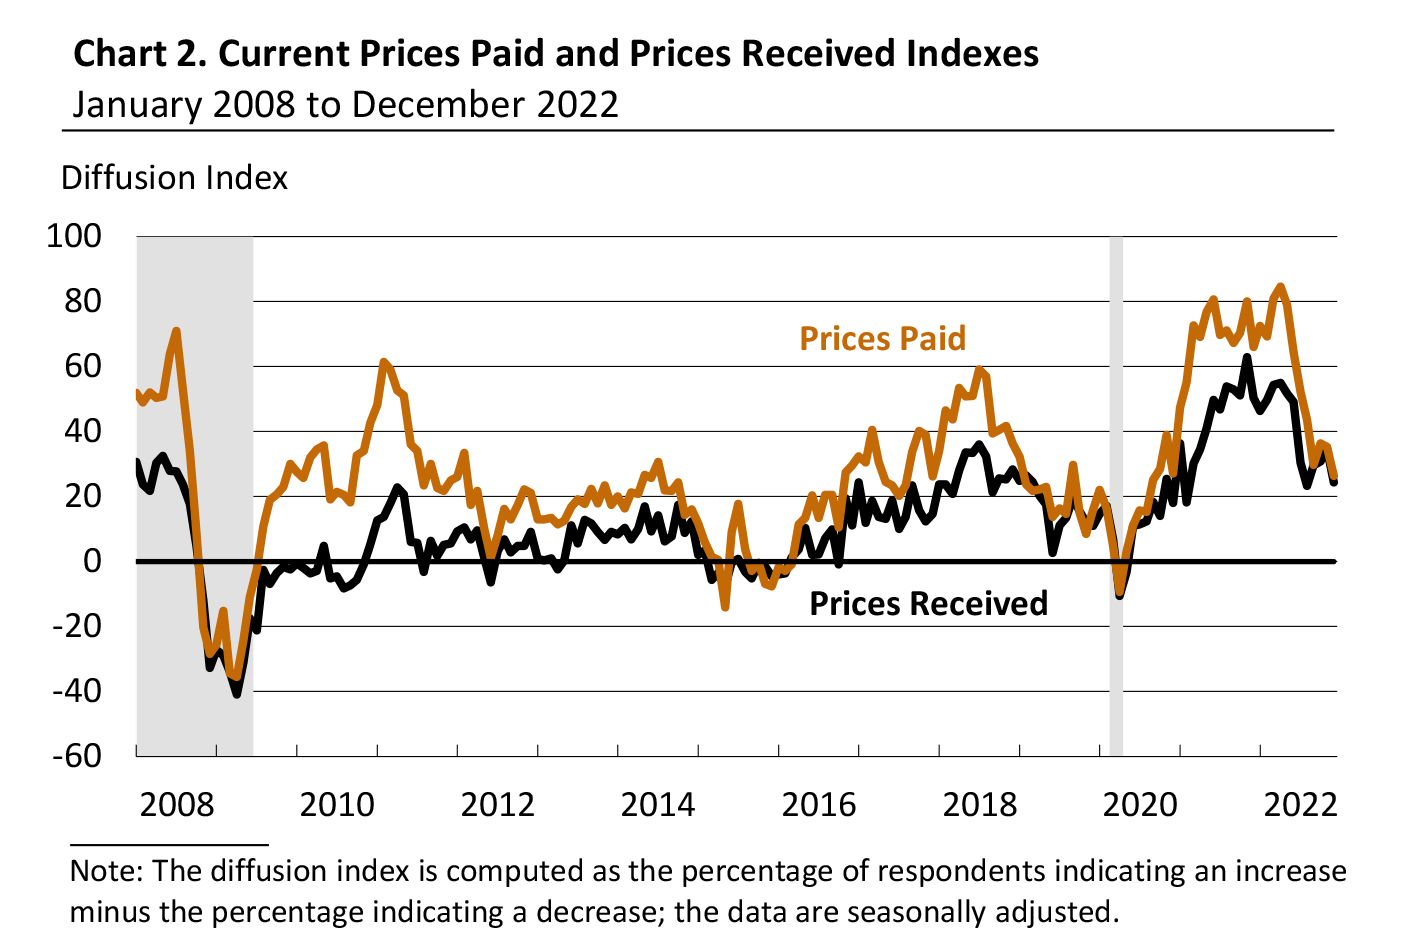
The firms continued to report overall increases in prices, but the indexes for prices paid and prices received both declined this month. The current prices paid index decreased 9 points to 26.4, its lowest reading since September 2020 and near its long-run average (see Chart 2). Over 29 percent of the firms reported increases in input prices, while 3 percent reported decreases; 66 percent of the firms reported no change. The current prices received index decreased 10 points to 24.3. Roughly one-quarter of the firms reported increases in prices received for their own goods this month, none reported decreases, and 75 percent reported no change.
Firms' Reports Are Mixed on Production, Higher on Capacity Utilization
In this month's special questions, the firms were asked to estimate their total production growth for the fourth quarter ending this month compared with the third quarter of 2022. A slightly higher share of firms reported a decline in production (41 percent) compared with an increase in production (36 percent). Regarding firms' capacity utilization rate for the current quarter and one year ago, the median current capacity utilization rate reported among the responding firms was 80 to 90 percent, slightly higher than the 70 to 80 percent that was reported for one year ago. Although most firms reported labor supply and supply chains as slight or moderate constraints to capacity utilization, 30 percent indicated labor as a significant constraint and 23 percent indicated supply chains as a significant constraint. Looking ahead over the next three months, most firms expect the impacts of various factors to stay the same; however, more than 26 percent of the firms expect financial capital impacts to worsen, up from 8 percent when this question was asked in September.
Future Indicators Improve
The diffusion index for future general activity increased for the second consecutive month, rising 10 points to 3.8, its first positive reading since May (see Chart 1). The share of firms that expected increases in activity (37 percent) slightly exceeded the share of firms that expected decreases (33 percent); 27 percent expected no change. The future new orders index turned positive, climbing 18 points to 13.6, and the future shipments index increased from 10.2 to 22.5. The firms continued to expect increases in employment over the next six months, and the future employment index rose 7 points to 18.4. Nearly 29 percent of the firms expect to increase employment in their manufacturing plants over the next six months; 11 percent anticipate employment declines. The future capital expenditures index increased from 6.4 to 18.0.
Summary
Responses to the December Manufacturing Business Outlook Survey suggest continued declines for the region's manufacturing sector. The survey's indicators for general activity, new orders, and shipments were all negative, and the firms reported a decline in employment, on balance. The survey's broad indicators for future activity improved and indicate firms expect growth overall over the next six months.
Special Questions (December 2022)
1. How will your firm's total production for the fourth quarter of 2022
compare with that of the third quarter of 2022?
| An increase of: |
% of firms |
Subtotals |
| 10% or more |
12.8 |
% of firms reporting an increase: 35.9 |
| 5-10% |
7.7 |
| 0-5% |
15.4 |
| No change |
23.1 |
|
| A decline of: |
|
|
| 0-5% |
15.4 |
% of firms reporting a decrease: 41.0 |
| 5-10% |
15.4 |
| 10% or more |
10.2 |
2. Which of the following best characterizes your plant's percentage capacity utilization currently
(2022:Q4) and one year ago (2021:Q4)?
Capacity Utilization Rate |
2022:Q4
% of Reporters |
2021:Q4
% of Reporters |
| Less than 30% |
0.0 |
2.6 |
| 30-40% |
2.6 |
2.6 |
| 40-50% |
0.0 |
2.6 |
| 50-60% |
5.1 |
5.3 |
| 60-70% |
25.6 |
28.9 |
| 70-80% |
15.4 |
18.4 |
| 80-90% |
30.8 |
18.4 |
| 90-100% |
20.5 |
21.1 |
| Median Utilization Rate |
80-90 |
70-80 |
3. In the current quarter, to what degree have the following factors acted as constraints on capacity utilization?
| |
Not at all
(%)
|
Slightly
(%)
|
Moderately
(%) |
Significantly
(%) |
| COVID-19 mitigation measures |
74.4 |
23.1 |
2.6 |
0.0 |
| Energy markets |
69.2 |
17.9 |
7.7 |
5.1 |
| Financial capital
|
84.6 |
12.8 |
2.6 |
0.0 |
|
Labor supply
|
15.0 |
27.5 |
27.5 |
30.0 |
| Supply chains |
15.0 |
40.0 |
22.5 |
22.5 |
| Other factors |
66.7 |
4.8 |
9.5 |
19.0 |
4. Over the next three months, how do you expect the impacts of the following factors as constraints on capacity utilization to change?
| |
Worsen
(%)
|
Stay the same
(%)
|
Improve
(%)
|
| COVID-19 mitigation measures |
10.3 |
82.1 |
7.7 |
| Energy markets |
20.5 |
66.7 |
12.8 |
|
Financial capital
|
26.3 |
73.7 |
0.0 |
|
Labor supply
|
12.5 |
70.0 |
17.5 |
| Supply chains |
15.0 |
65.0 |
20.0 |
| Other factors |
15.8 |
78.9 |
5.3 |