Responses to the April Nonmanufacturing Business Outlook Survey suggest expansion in nonmanufacturing activity in the region. The indexes for general activity at the firm level, sales/revenues, and new orders all declined slightly but remained positive. Prices for firms' inputs and own goods continue to sustain overall increases, according to the prices paid and prices received indexes. The respondents continued to anticipate growth over the next six months.
Current Indexes Remain Positive
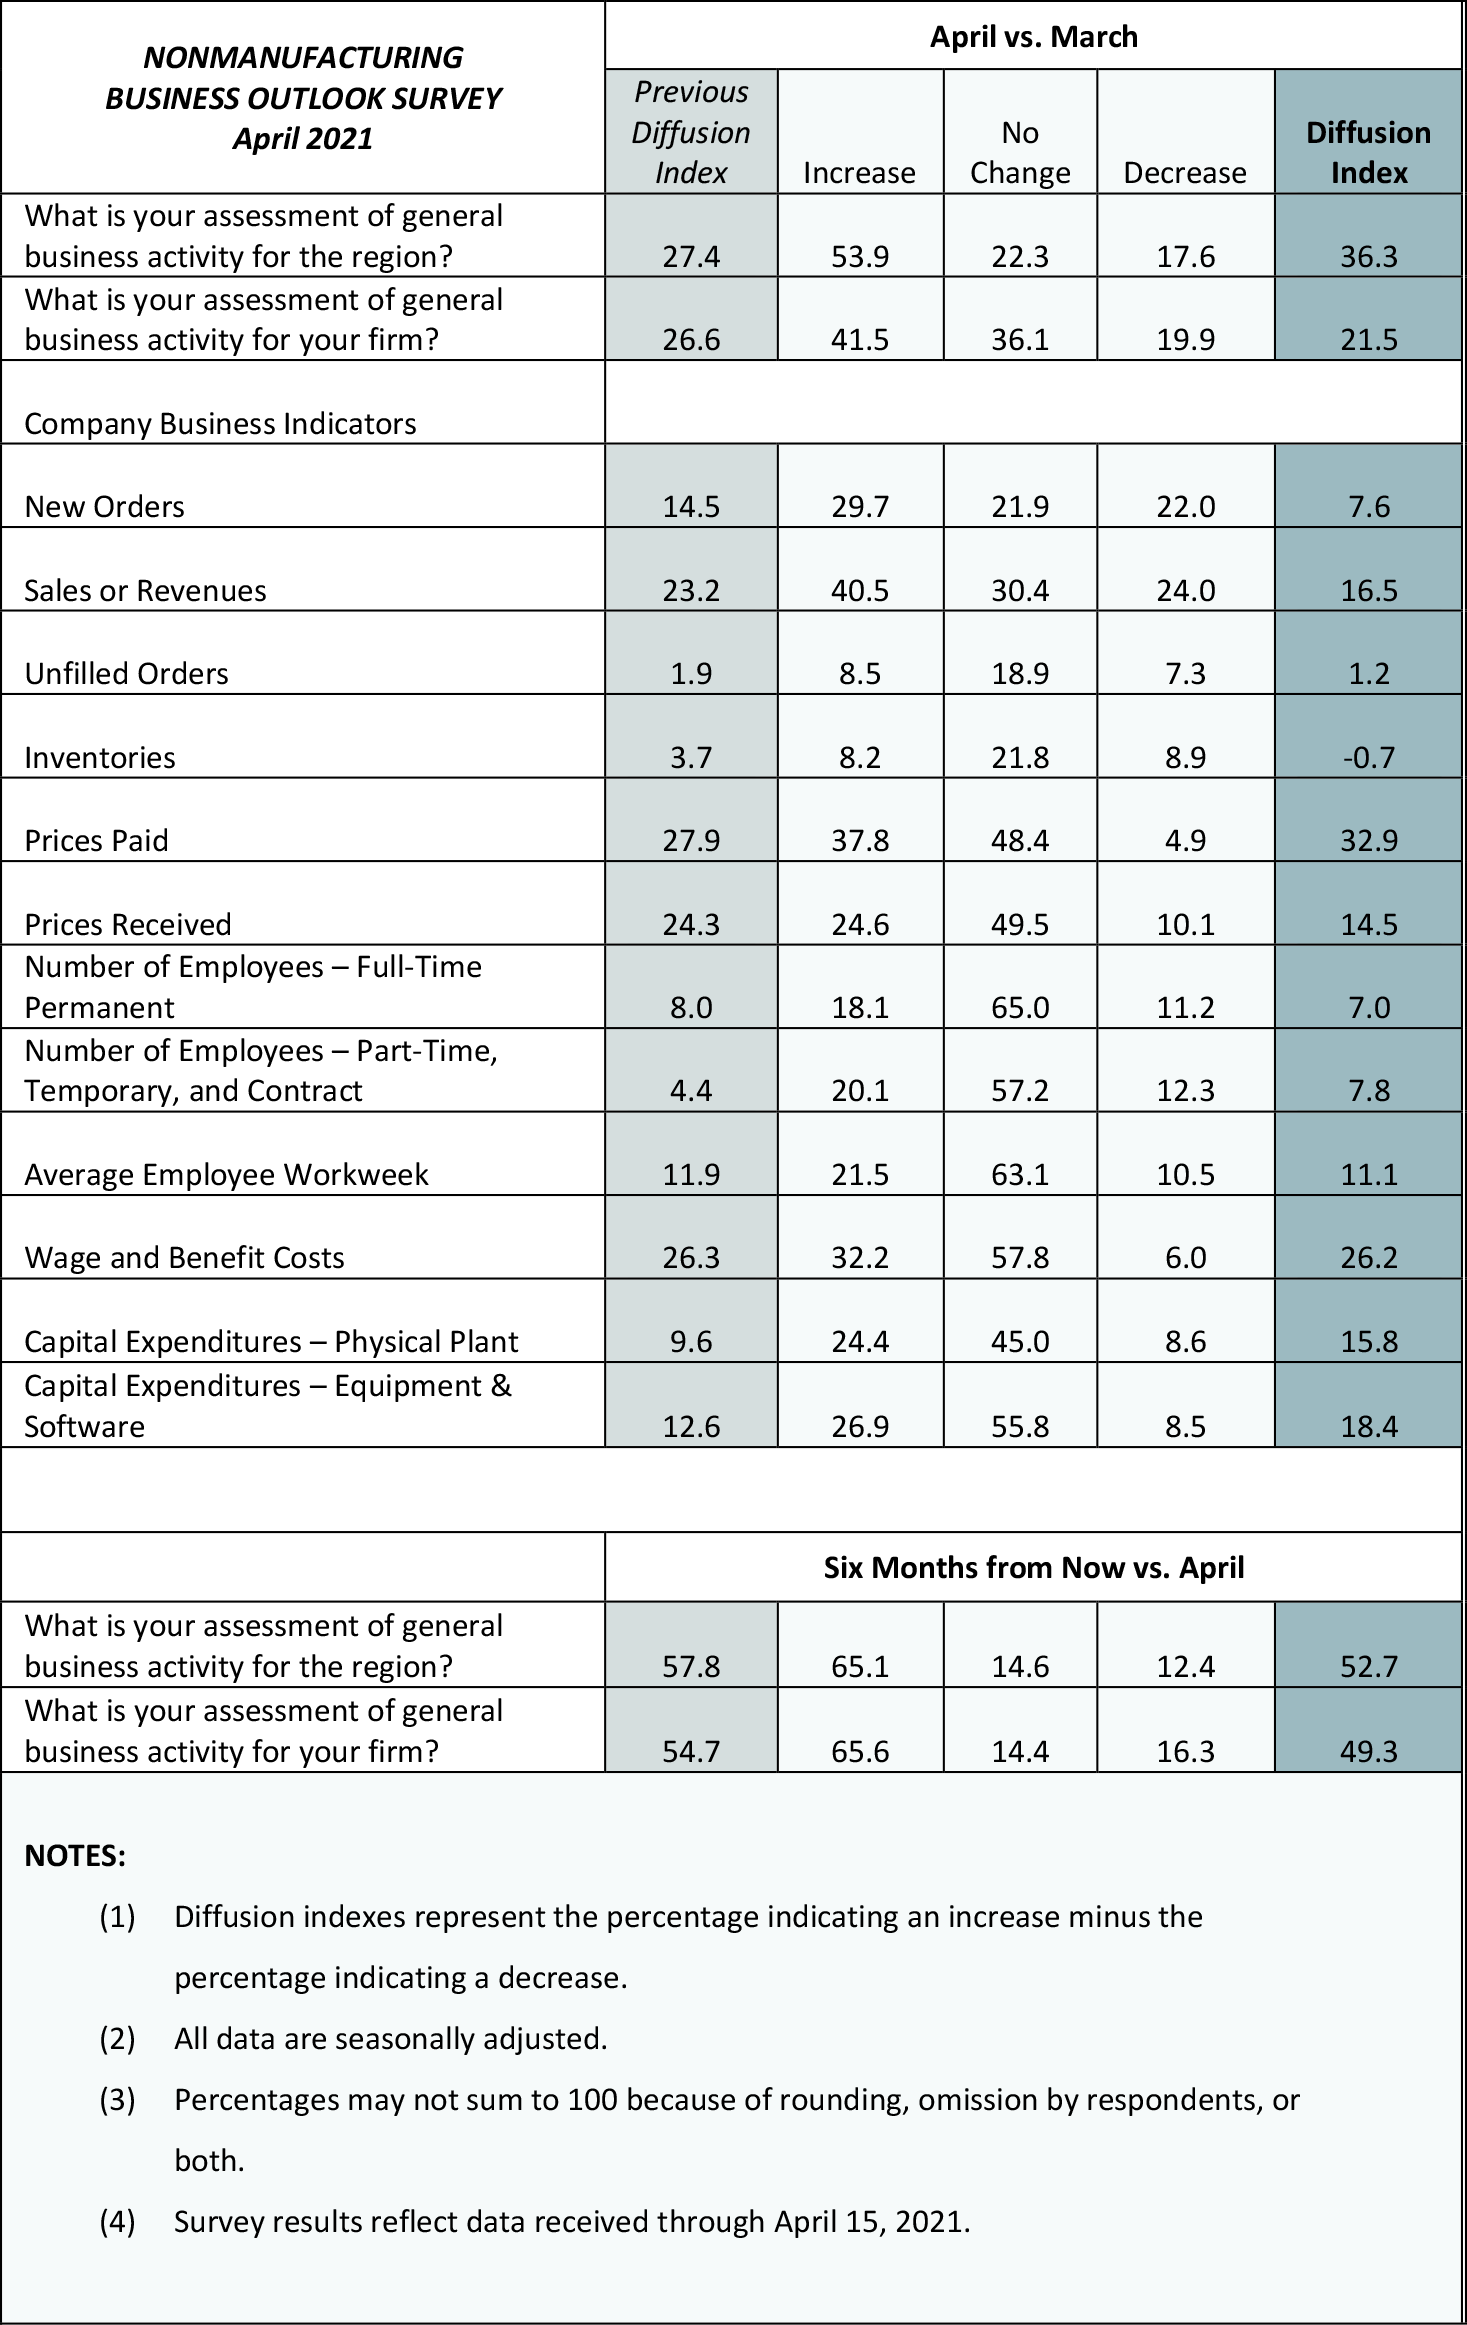
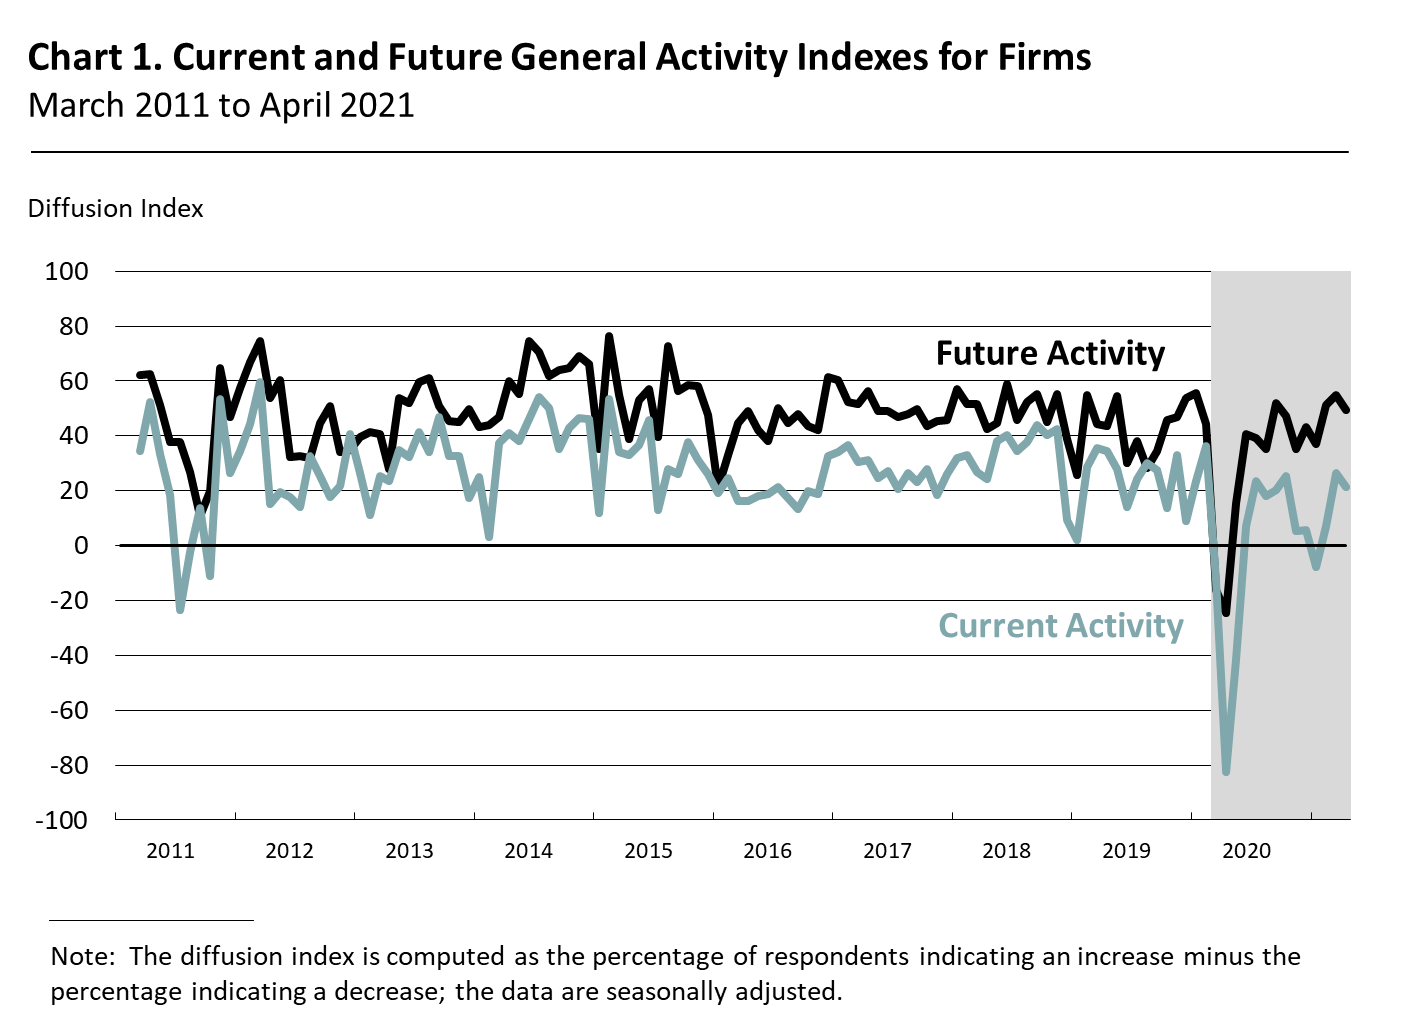
The diffusion index for current general activity at the firm level declined from a revised reading of 26.6 in March to 21.5 this month (see Chart 1).* Nearly 42 percent of the firms reported increases in activity, and 20 percent reported decreases. The new orders index fell 7 points to a reading of 7.6 in April, and the index for sales/revenues fell from a revised reading of 23.2 in March to 16.5 this month. Nearly 41 percent of the responding firms reported increases in sales/revenues, while 24 percent reported decreases. The regional activity index rose 9 points to 36.3.
Employment Indicators Hold Mostly Steady
The full-time employment index edged down 1 point to 7.0 in April. Sixty-five percent of the firms reported steady full-time employment levels, while the share of firms reporting increases (18 percent) was higher than the share reporting decreases (11 percent). The part-time employment index rose 3 points to 7.8, while the wages and benefits indicator held steady at 26.2. The average workweek index edged down 1 point to 11.1.
Respondents Continue to Report Overall Price Increases
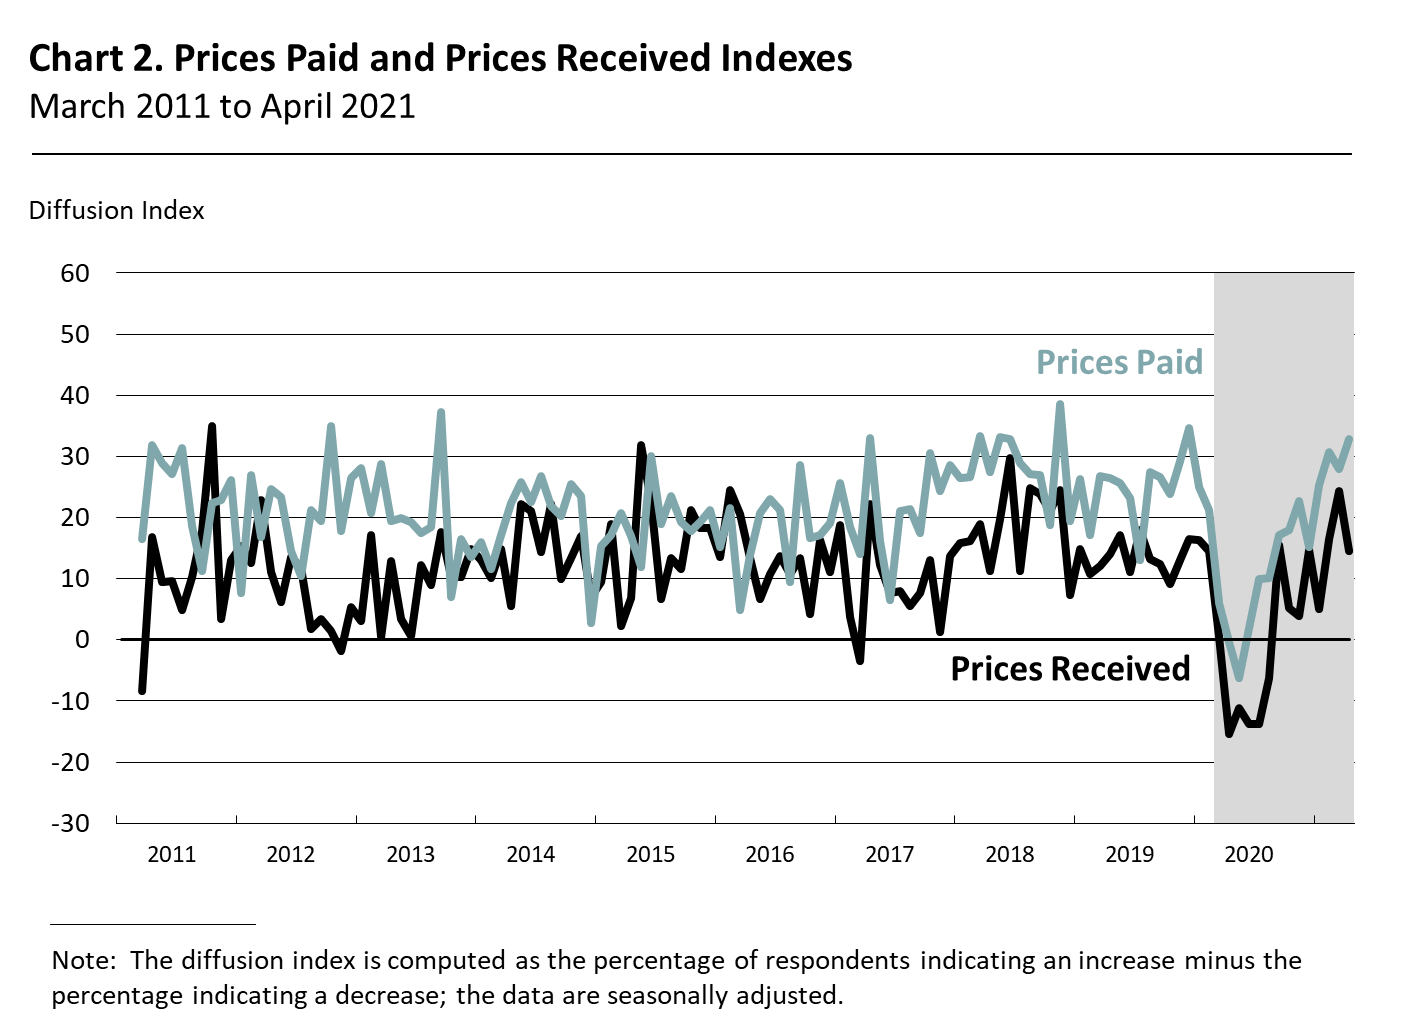
The prices paid index rose 5 points to 32.9 (see Chart 2). Nearly 38 percent of the respondents reported increases in their input prices, while only 5 percent reported decreases. More than 48 percent of the respondents reported stable input prices. Regarding prices for firms' own goods and services, the prices received index decreased from a revised reading of 24.3 in March to 14.5 in April. The share of firms reporting increases in prices received (25 percent) exceeded the share reporting decreases (10 percent). Half of the firms reported steady prices for their own goods and services.
Firms Report Increases in Wages and Compensation
In special questions this month, the firms were asked generally about changes in wages and compensation over the past three months, how these recent or planned changes will affect their budget for the rest of the year, and the components of these changes (see Special Questions). Nearly 39 percent of the firms indicated increases in wages and compensation costs over the past three months, 54 percent reported no change, and 6 percent reported decreases.
Almost 32 percent of the firms reported adjusting their 2021 budgets for wages and compensation since the beginning of the year, with 13 percent indicating they are planning to increase wages and compensation by more than originally planned and 19 percent of the firms indicating they are planning to increase wages and compensation sooner than originally planned. Based on the median reporter, firms expect increases of 2 to 3 percent for wages and for total compensation in 2021.
Firms Continue to Anticipate Growth
Both future activity indexes declined but continue to suggest that firms anticipate growth over the next six months. The diffusion index for future activity at the firm level fell from a revised reading of 54.7 in March to 49.3 this month (see Chart 1). Nearly 66 percent of the firms expect an increase in activity at their firms over the next six months, compared with 16 percent that expect decreases and 14 percent that expect no change. The future regional activity index decreased 5 points to 52.7.
Summary
Responses to this month's Nonmanufacturing Business Outlook Survey suggest expansion in nonmanufacturing activity in the region. The indicators for firm-level general activity, new orders, and sales/revenues all declined modestly but remain positive. Additionally, the firms continue to report overall increases in prices and employment. Overall, the respondents continue to expect growth over the next six months.
*With the April report, Philadelphia Fed researchers released revised historical data, which incorporate adjusted seasonal factors for 2020 and 2021. The full set of historical data and a brief discussion of the revisions are available here.
Special Questions (April 2021)
1. How have wages and compensation changed at your firm over the past three months?**
|
Percent (%) |
| Increased |
38.5 |
| No Change |
53.8 |
| Decreased |
5.5 |
2. Since the beginning of the year, have you adjusted your budget for wages and compensation for 2021?***
|
Percent (%) |
| Yes, and we are planning to increase wages and compensation by more than originally planned. |
13.2 |
| Yes, and we are planning to increase wages and compensation sooner than originally planned. |
18.7 |
| No, we have not needed to make adjustments. |
65.9 |
| Other |
4.4 |
3. What percentage change in costs do you now expect for the following categories over all of 2021?**
| |
Wages
(%)
|
Health
Benefits
(%)
|
Nonhealth
Benefits
(%)
|
Wages + Health + Nonhealth (%) |
|
Decline of 3–4%
|
1.2
|
1.3 |
1.3 |
1.3 |
|
Decline of 2–3%
|
1.2 |
1.3 |
0.0
|
1.3 |
|
Decline of 1–2%
|
1.2 |
0.0 |
0.0 |
1.3 |
|
No change
|
25.9 |
37.5 |
66.7 |
16.5 |
|
Increase of 1–2%
|
11.8 |
10.0 |
12.8 |
13.9 |
|
Increase of 2–3%
|
22.4 |
10.0 |
7.7 |
17.7 |
|
Increase of 3–4%
|
14.1 |
6.3 |
6.4 |
16.5 |
|
Increase of 4–5%
|
11.8 |
10.0 |
0.0 |
8.9 |
|
Increase of 5–7.5%
|
3.5 |
6.3 |
0.0 |
11.4 |
|
Increase of 7.5–10% |
2.4 |
11.3 |
2.6 |
2.5 |
|
Increase of 10% or More |
4.7 |
6.3 |
2.6 |
8.9 |
|
Median Expected Change |
2–3% |
1–2% |
No Change |
2–3% |
**Percentages may not sum to 100 because of rounding, omission by respondents, or both.
***Percentages do not sum to 100 because more than one option could be selected.
Summary of Returns (April 2021)