Manufacturing activity in the region continued to grow, according to the firms responding to the January Manufacturing Business Outlook Survey. The survey's indicators for general activity, shipments, and new orders posted modest increases after falling sharply last month. The employment index remained positive but decreased. The price indexes remained elevated. Responding firms remained generally optimistic about growth over the next six months.
Current Indicators Recover Somewhat
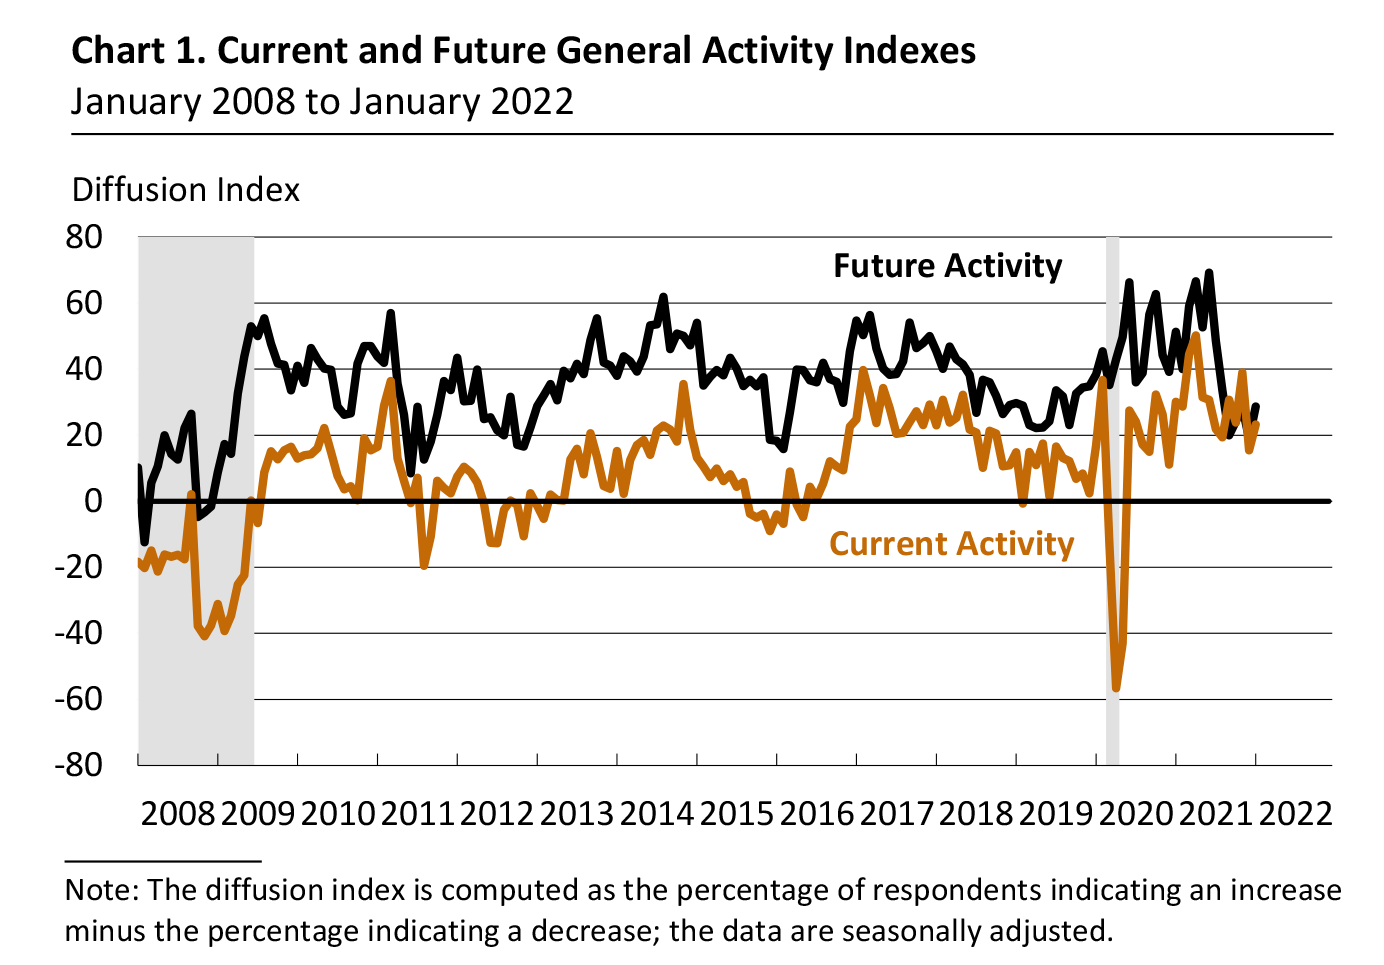
The diffusion index for current general activity climbed 8 points to 23.2 in January after falling 24 points in December (see Chart 1). Almost 31 percent of the firms reported increases in current activity this month, while 7 percent reported decreases; most (60 percent) reported no change. The current shipments index increased 6 points to 20.8. The share of firms reporting increases in shipments (39 percent) exceeded the share of firms reporting decreases (19 percent). The index for new orders, which had fallen 34 points last month, rose 4 points to 17.9 this month. More than 36 percent of the firms reported increases in new orders this month compared with 18 percent that reported decreases.
On balance, the firms continued to report increases in employment, but the employment index declined from 33.9 in December to 26.1 this month. The majority of responding firms (63 percent) reported steady employment levels, and the share reporting increases (31 percent) exceeded the share reporting decreases (5 percent). The average workweek index dropped from 30.4 to 9.6, its lowest reading since September 2020.
Price Increases Remain Widespread
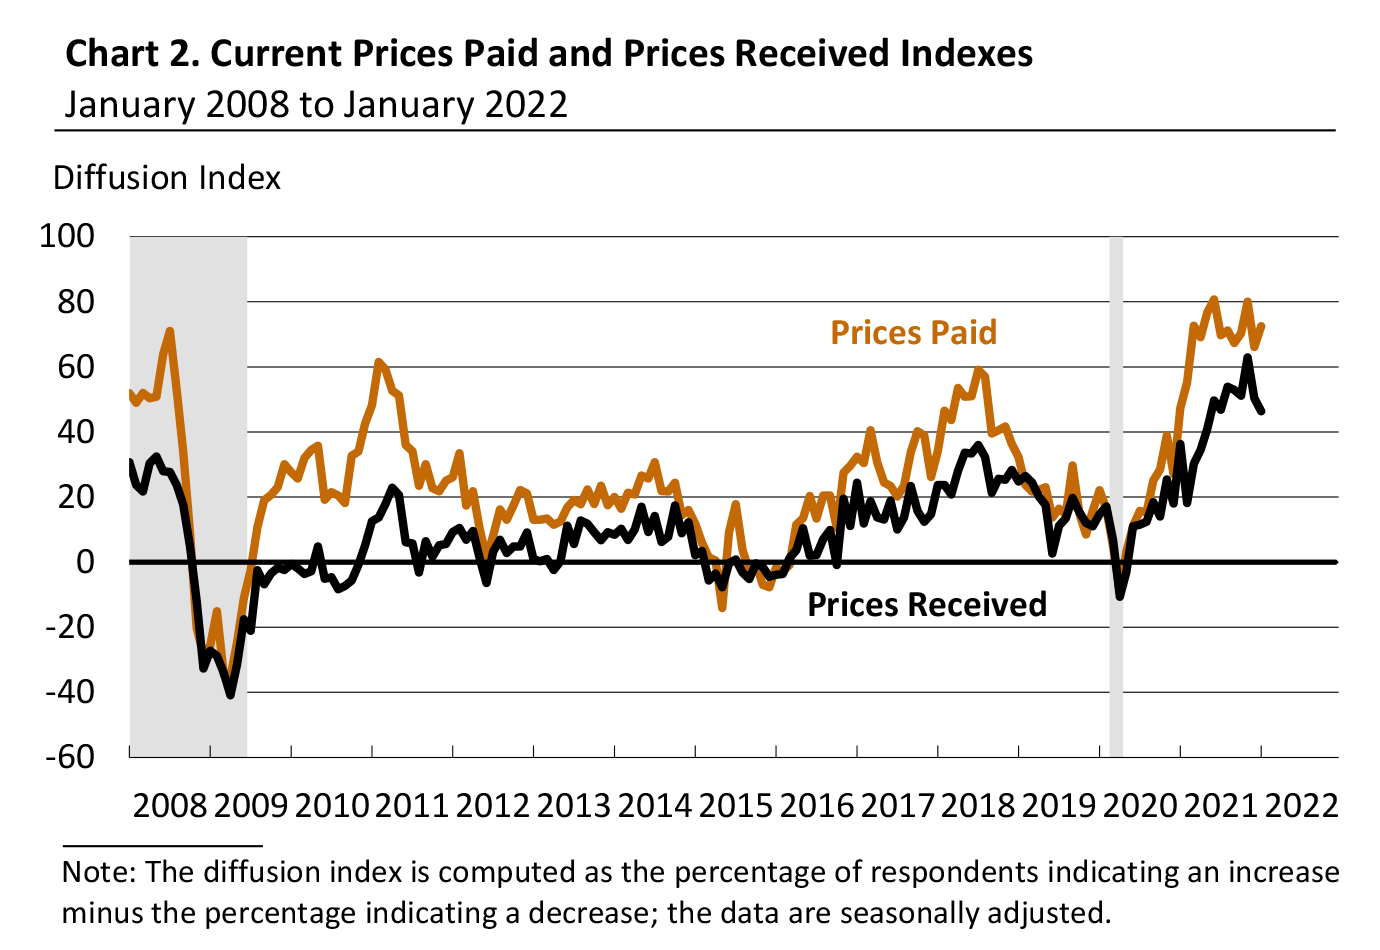
The indicators for prices paid and prices received moved in different directions this month but remained elevated. The
prices paid index increased 6 points to 72.5 (see Chart 2). Almost 73 percent of the firms reported increases in input prices, while none reported decreases; 27 percent of the firms reported no change. The current prices received index declined 4 points to 46.4, its second consecutive decrease. Just over half of the firms reported increases in prices received for their own goods this month, 4 percent reported decreases, and 45 percent reported no change.
Firms Expect Highest Cost Increases for Raw Materials
In this month's special questions, the firms were asked about their expectations for changes in various input and labor costs for the coming year. Responses indicate an expected average increase of 8.9 percent for raw materials, followed by energy, intermediate goods, health benefits, and total compensation (wages plus benefits), which are all expected to increase 6.4 percent on average. The firms also expect wages to rise an average of 4.9 percent in 2022. The respondents were also asked how the expected costs for 2022 will compare with the previous year's costs. On balance, the forecasts indicated increases across all categories of expenses relative to 2021.
Future Indicators Remain Positive
The diffusion index for future general activity rose from 19.0 to 28.7, recovering its 10 point decline from last month (see Chart 1). More than 44 percent of the firms expect increases in future activity, 16 percent expect decreases, and 39 percent expect no change. The future new orders and future shipments indexes rose 5 points and 14 points, respectively. The future employment index fell 19 points to 38.4 but continues to suggest that firms expect overall increases in employment over the next six months. Half of the firms expect steady employment levels, 41 percent of the firms expect to increase employment in their manufacturing plants over the next six months, and 2 percent expect employment declines. Future price indexes suggest that firms expect price increases to remain widespread over the next six months: The future prices paid index rose 23 points to 76.4, its highest reading since August 1988, and the future prices received index rose 8 points to 62.6.
Summary
Responses to the January Manufacturing Business Outlook Survey suggest continued expansion in regional manufacturing conditions this month. The indicators for current activity, shipments, and new orders improved from their December readings. The price indexes continue to suggest widespread increases in prices and remain elevated. The survey's future indexes indicated that respondents continue to expect overall growth over the next six
months.
Special Questions (January 2022)
1. What percentage change in costs do you expect for the following categories in 2022?*
| |
Energy
(%)
|
Other Raw Materials
(%)
|
Intermediate Goods
(%)
|
Wages
(%)
|
Health Benefits
(%)
|
Nonhealth Benefits
(%)
|
Wages + Health Benefits + Nonhealth Benefits (%) |
|
Decline of more than 1%
|
4.8 |
2.4 |
0.0
|
0.0
|
2.4 |
0.0
|
2.4 |
|
No change
|
9.5 |
2.4 |
7.7 |
0.0 |
11.9 |
20.0 |
2.4 |
|
Increase of 1–2%
|
2.4 |
0.0 |
0.0
|
4.7 |
0.0
|
7.5 |
2.4 |
|
Increase of 2–3%
|
7.1 |
4.8 |
7.7 |
9.3 |
7.1 |
20.0 |
4.9 |
|
Increase of 3–4%
|
7.1 |
4.8 |
15.4 |
23.3 |
7.1 |
15.0 |
9.8 |
|
Increase of 4–5%
|
11.9 |
9.5 |
15.4 |
32.6 |
19.0 |
20.0 |
17.1 |
|
Increase of 5–7.5%
|
19.0 |
21.4 |
25.6 |
25.6 |
21.4 |
12.5 |
31.7 |
|
Increase of 7.5–10%
|
19.0 |
19.0 |
15.4 |
2.3 |
9.5 |
2.5 |
17.1 |
|
Increase of 10–12.5%
|
7.1 |
16.7 |
5.1 |
0.0 |
11.9 |
2.5 |
4.9 |
|
Increase of more than 12.5%
|
11.9 |
19.0 |
7.7 |
2.3
|
9.5 |
0.0 |
7.3 |
|
Average Expected Change |
6.4 |
8.9 |
6.4 |
4.9 |
6.4 |
3.3 |
6.4 |
| *The firms responded to more detailed changes than shown in the provided ranges. |
2. Do you expect these changes in costs to be higher, the same, or lower than the actual cost changes for 2021?
| |
Energy
(%)
|
Other Raw Materials
(%)
|
Intermediate Goods
(%)
|
Wages
(%)
|
Health Benefits
(%)
|
Nonhealth Benefits
(%)
|
Wages + Health Benefits + Nonhealth Benefits (%) |
| Higher |
75.0 |
72.7 |
76.2 |
84.1 |
72.7 |
62.8 |
83.7 |
| Same |
22.7 |
15.9 |
21.4 |
11.4 |
25.0 |
34.9 |
16.3 |
| Lower |
2.3 |
11.4 |
2.4 |
4.5 |
2.3 |
2.3 |
0.0 |
| Diffusion Index (Higher Minus Lower) |
72.7 |
61.4 |
73.8 |
79.5 |
70.5 |
60.5 |
83.7 |