Manufacturing activity held mostly steady on balance, according to the firms responding to the August Manufacturing Business Outlook Survey. Most of the survey's indicators rose from last month. Although the general activity index turned positive, it was low, and the new orders index remained negative. The employment index increased, while the price indexes continued to decline but remained elevated. The survey's future indexes rose slightly but continue to suggest that the firms expect overall declines six months from now.
Current Indicators Are Mixed
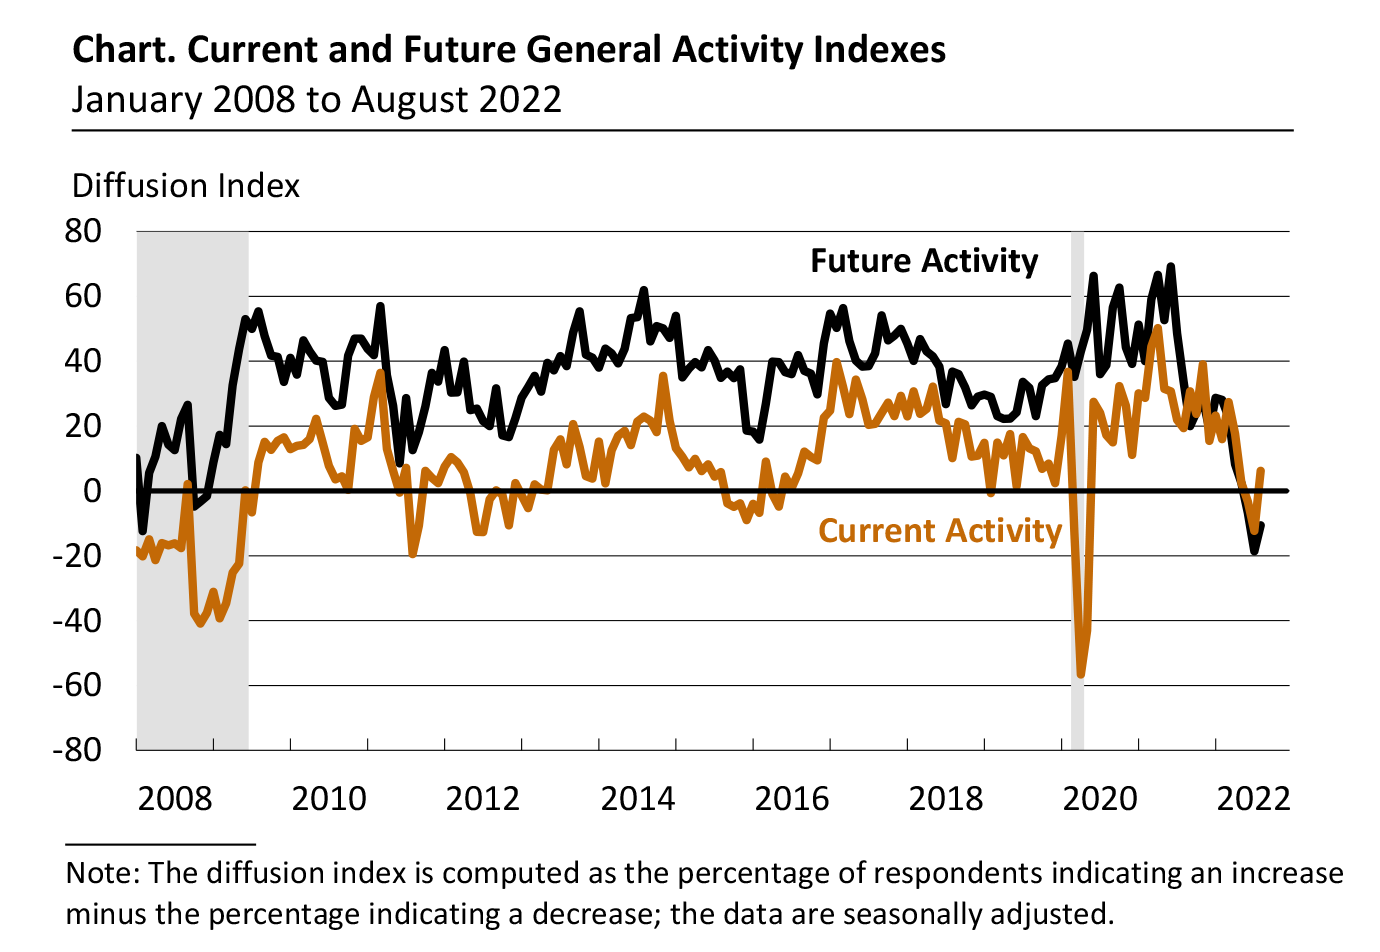
The diffusion index for current activity returned to positive territory in August after two consecutive negative readings, rising 19 points to 6.2 (see Chart). Most firms (47 percent) reported no change in current activity this month, while the share of firms reporting increases (26 percent) exceeded the share reporting decreases (20 percent). The index for current new orders climbed 20 points but remained negative for the third consecutive month at -5.1, and the current shipments index rose 10 points to 24.8.
On balance, the firms reported increases in manufacturing employment, and the current employment index increased 5 points to 24.1. Although most firms (68 percent) reported steady employment levels, 28 percent of the firms reported higher employment, while 4 percent reported lower employment. The average workweek index was little changed at 6.1.
Price Indexes Continue to Decline but Remain Elevated
The indexes for prices paid and prices received continue to indicate widespread price increases but declined for the fourth consecutive month. The prices paid diffusion index decreased 9 points to 43.6, its lowest reading since December 2020. Fifty-six percent of the firms reported increases in input prices, and 12 percent reported decreases; 32 percent reported no change. The current prices received index moved down 7 points to 23.3, its lowest reading since February 2021. Nearly 31 percent of the firms reported increases in the prices of their own goods, 8 percent reported decreases, and 62 percent reported no change.
Firms Expect Own Price Increases to Lag Inflation Rate
In this month's special questions, the firms were asked to forecast the changes in prices of their own products and for U.S. consumers over the next four quarters. Regarding their own prices over the next year, the firms' median forecast was for an expected increase of 5.0 percent, unchanged from when this question was last asked in May. The firms reported a median increase of 10.0 percent in their own prices over the past year, up from 6.0 percent in May. The firms' median forecast for the rate of inflation for U.S. consumers over the next year was 6.0 percent, down from 6.5 percent in May. Over the long run, the firms' median forecast for the 10-year average inflation rate was 3.0 percent, down from 3.5 percent in May.
Future Indicators Remain Weak
The diffusion index for future general activity remained negative for the third consecutive month but rose 8 points to -10.6 (see Chart). Nearly 29 percent of the firms expect a decrease in activity over the next six months, exceeding the 18 percent that expect an increase; 46 percent expect no change. The future new orders index moved up 4 points but remained negative at -8.3, and the future shipments index inched down from 12.8 to 12.0. The future employment index increased 9 points to 25.1. The future capital expenditures index rose 14 points to 18.0, after falling to nearly a 10-year low last month; almost 27 percent of the firms expect to increase spending (up from 10 percent last month).
Summary
Responses to the August Manufacturing Business Outlook Survey suggest steady conditions, on balance, in the region's manufacturing sector. The indicator for current activity returned to positive, but low, territory, while the new orders index rose but remained negative. The firms continued to indicate overall increases in employment and widespread increases in prices paid and received. The survey's future indexes suggest tempered expectations for growth over the next six months.
Special Questions (August 2022)
|
Please list the annual percent change with respect to the following: |
|
Current
|
Previous
(May 2022)
|
|
For your firm:
|
|
Forecast for next year (2022Q3–2023Q3)
|
|
1. Prices your firm will receive (for its own goods and services sold).
|
5.0
|
5.0 |
|
2. Compensation your firm will pay per employee (for wages and benefits).
|
5.0 |
5.0 |
|
Last year's price change (2021Q3–2022Q3)
|
|
3. Prices your firm did receive (for its own goods and services sold) over the last year.
|
10.0 |
6.0 |
|
For U.S. consumers:
|
|
4. Prices U.S. consumers will pay for goods and services over the next year.
|
6.0
|
6.5
|
|
5. Prices U.S. consumers will pay for goods and services over the next 10 years (2022–2031).
|
3.0 |
3.5 |
|
The numbers represent medians of the individual forecasts (percent changes). For question 5, firms reported a 10-year annual-average change.
|