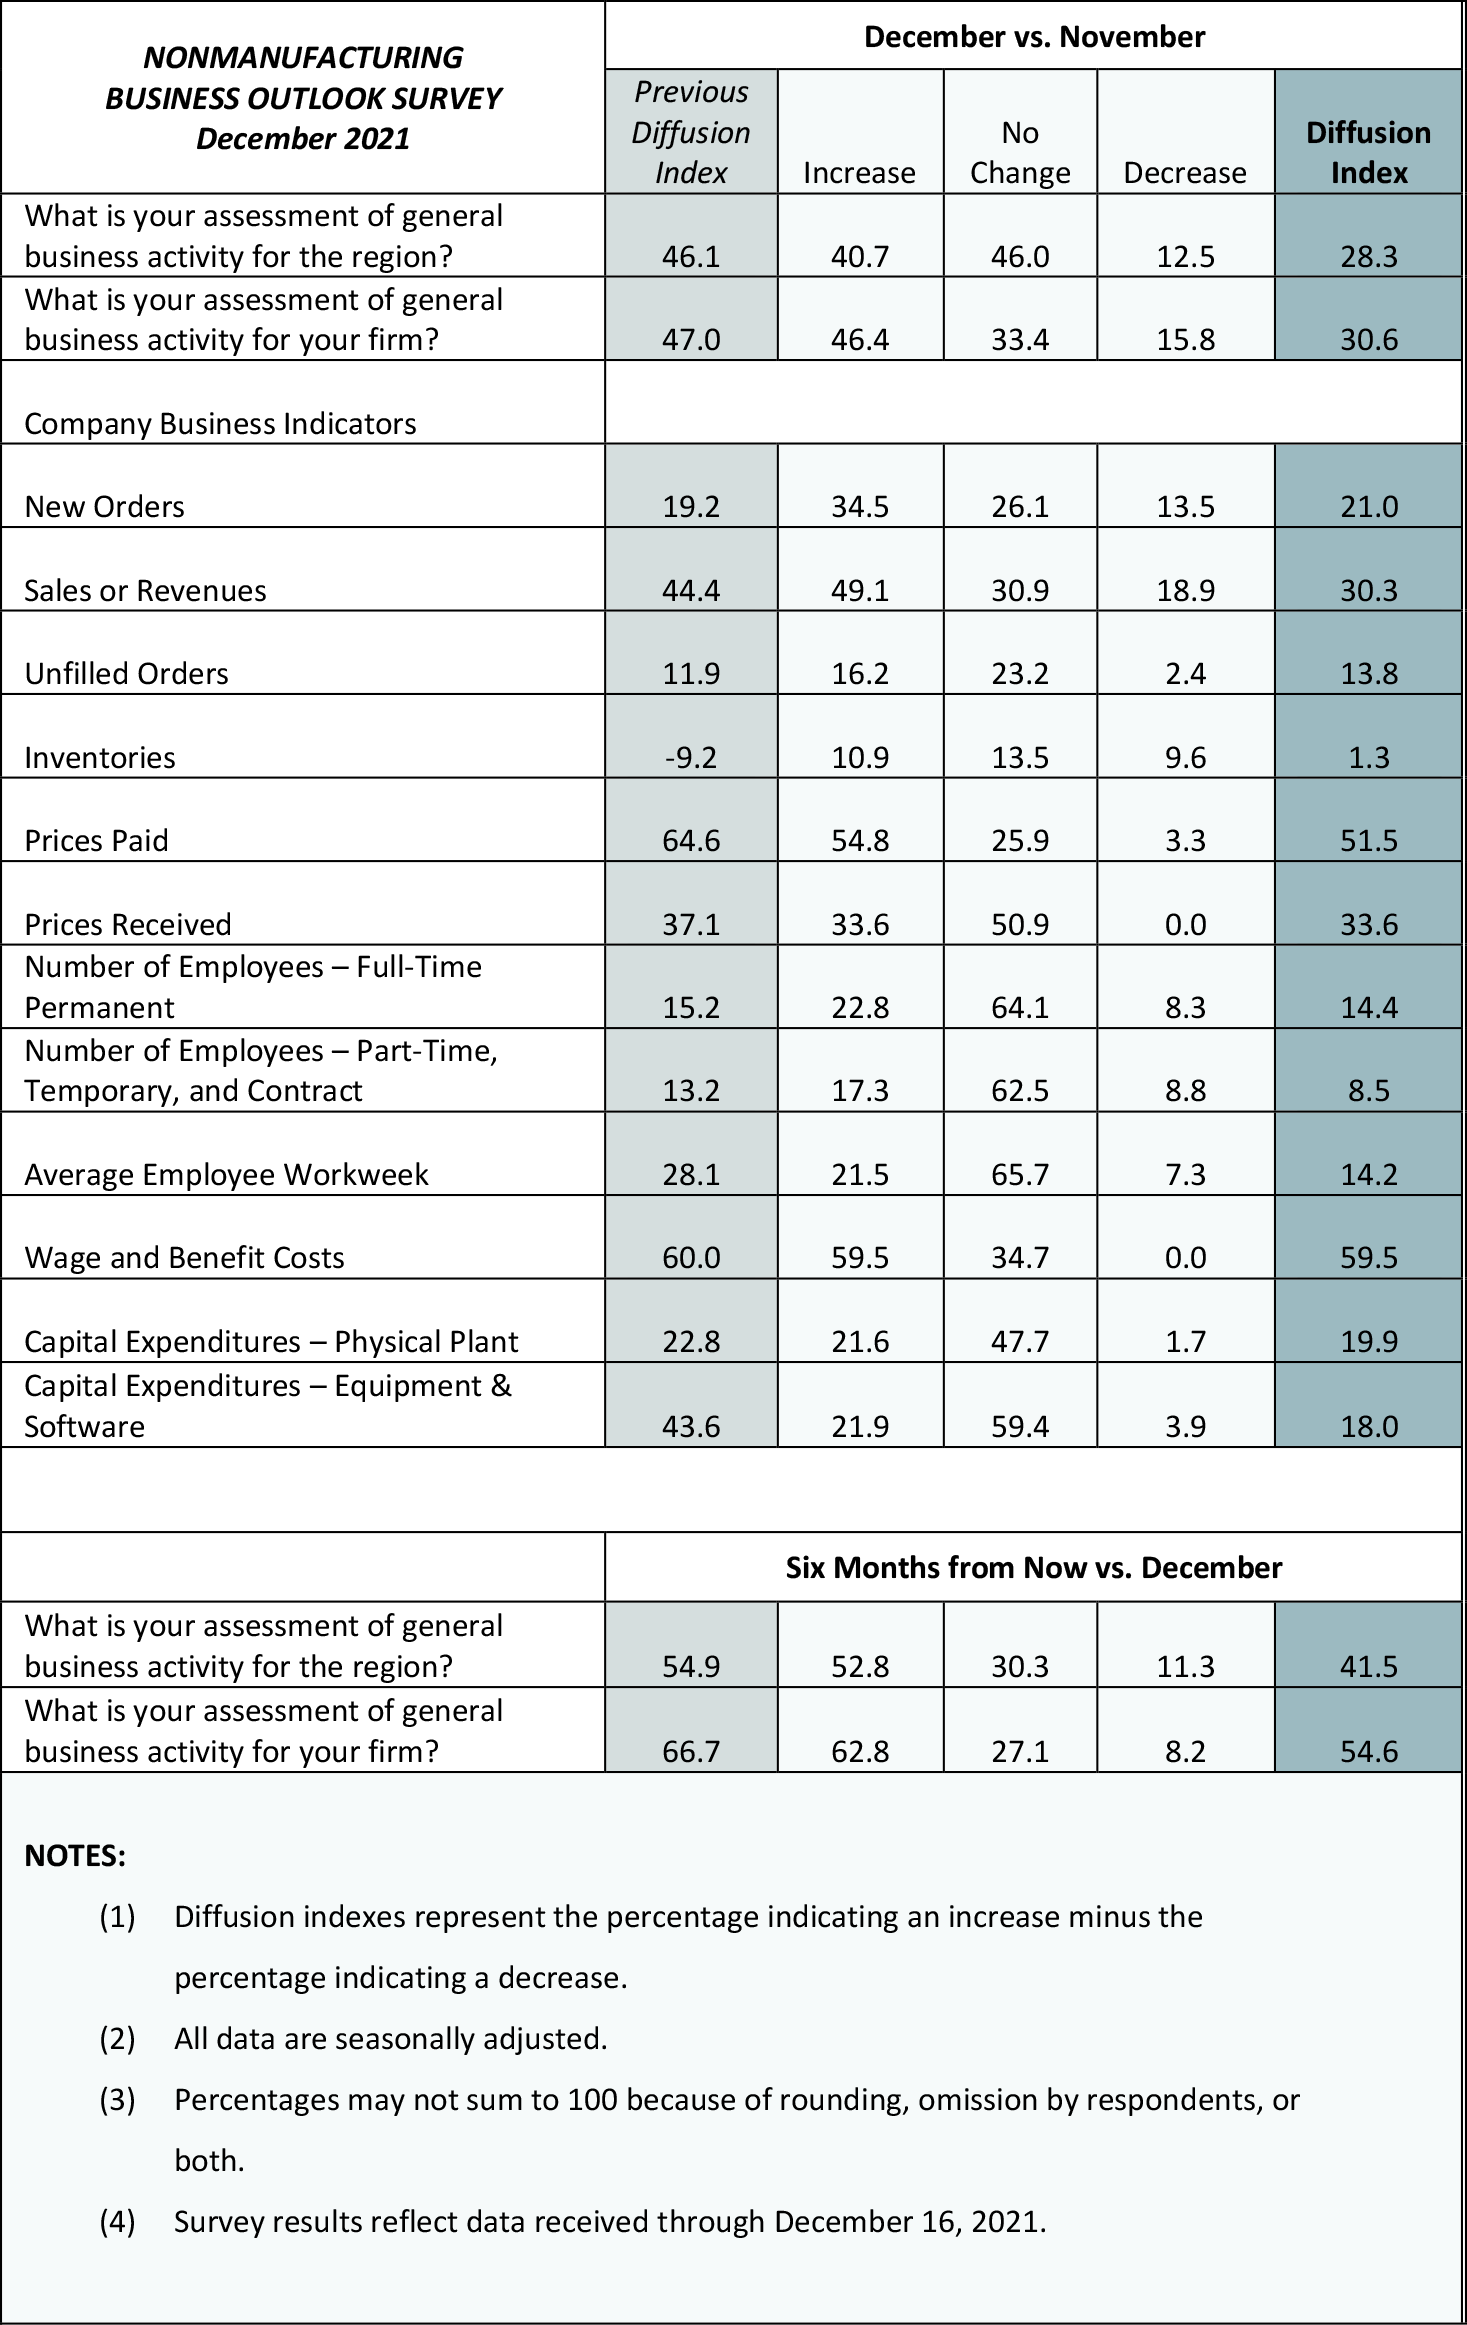
Responses to the December Nonmanufacturing Business Outlook Survey suggest continued growth in business activity in the region. The indicators for firm-level general activity and sales/revenues both declined moderately from last month, while the indicator for new orders increased slightly. The survey's indexes for employment decreased. Overall, the respondents continued to expect improvement in conditions over the next six months, but both future activity indexes fell.
Current Indicators Moderate but Remain Positive
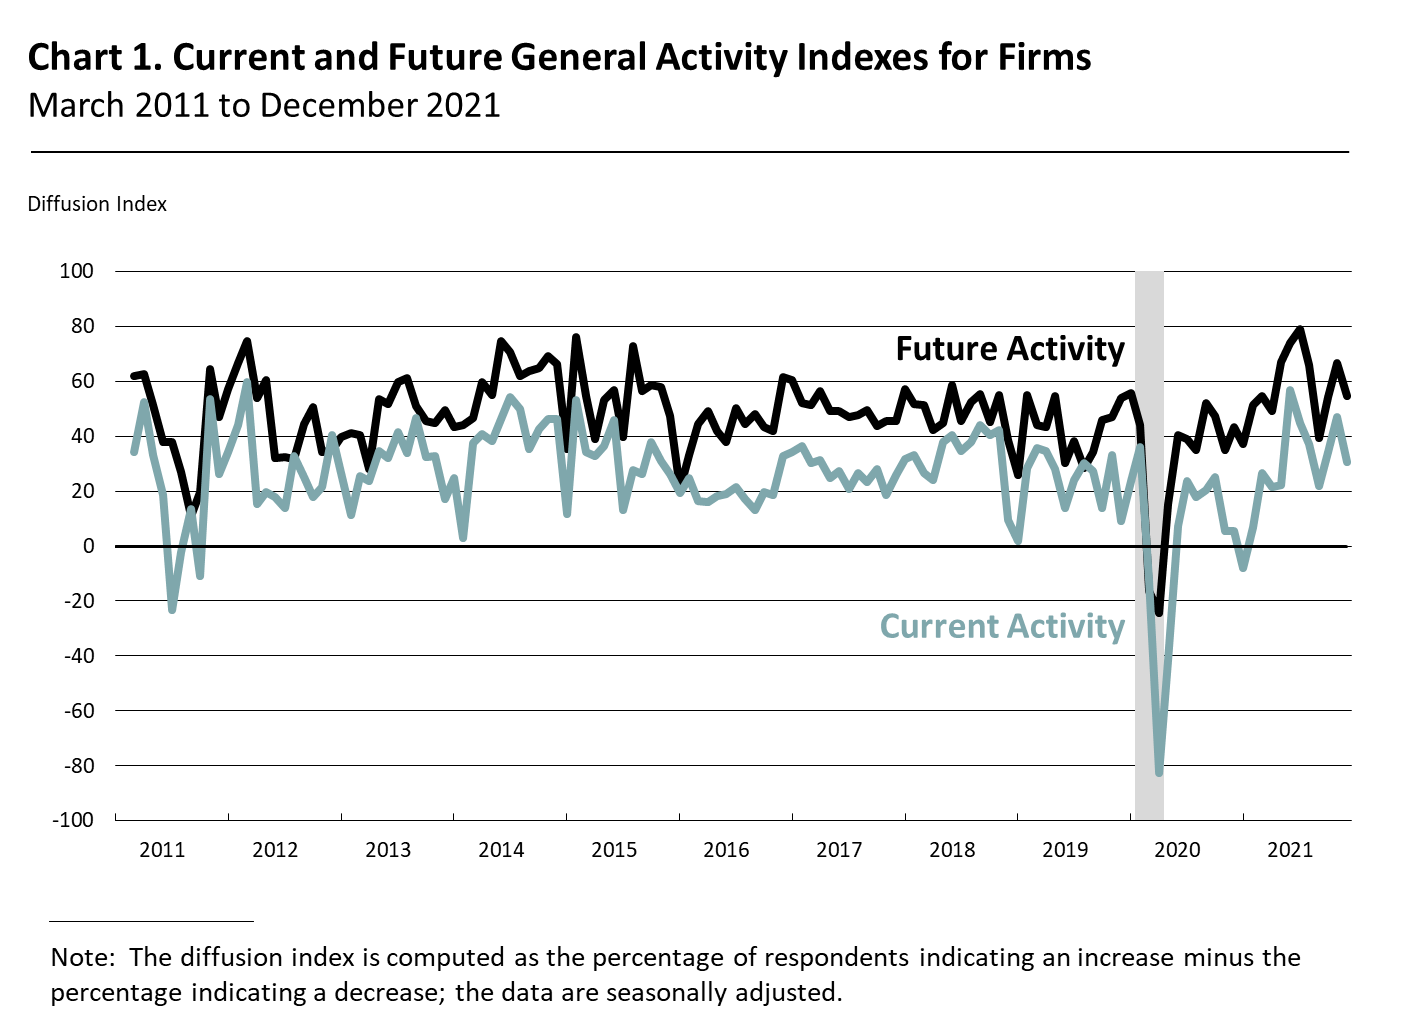
The diffusion index for current general activity at the firm level declined 16 points to 30.6 in December after rising 13 points last month (see Chart 1). More than 46 percent of the responding firms reported increases in general activity (down from 55 percent), while 16 percent of the firms reported decreases (up from 8 percent). The new orders index increased 2 points to 21.0 in December. The sales/revenues index fell from 44.4 in November to 30.3 in December. The share of firms reporting increases in sales/revenues (49 percent) exceeded the share reporting decreases (19 percent); nearly 31 percent reported no change (up from 15 percent last month). The current regional activity index decreased 18 points to 28.3 in December.
Employment Indicators Decline
The firms continued to report overall increases in full-time and part-time employment this month, but both indexes posted small declines. The full-time employment index edged down 1 point to 14.4. Of the firms responding, 23 percent reported increases in full-time employment, while 8 percent reported decreases. Most firms (64 percent) reported stable full-time employment. The part-time employment index fell 5 points to 8.5. Most firms reported steady part-time employment (63 percent), while 17 percent of the firms reported increases and 9 percent reported decreases.
Price Increases Remain Widespread
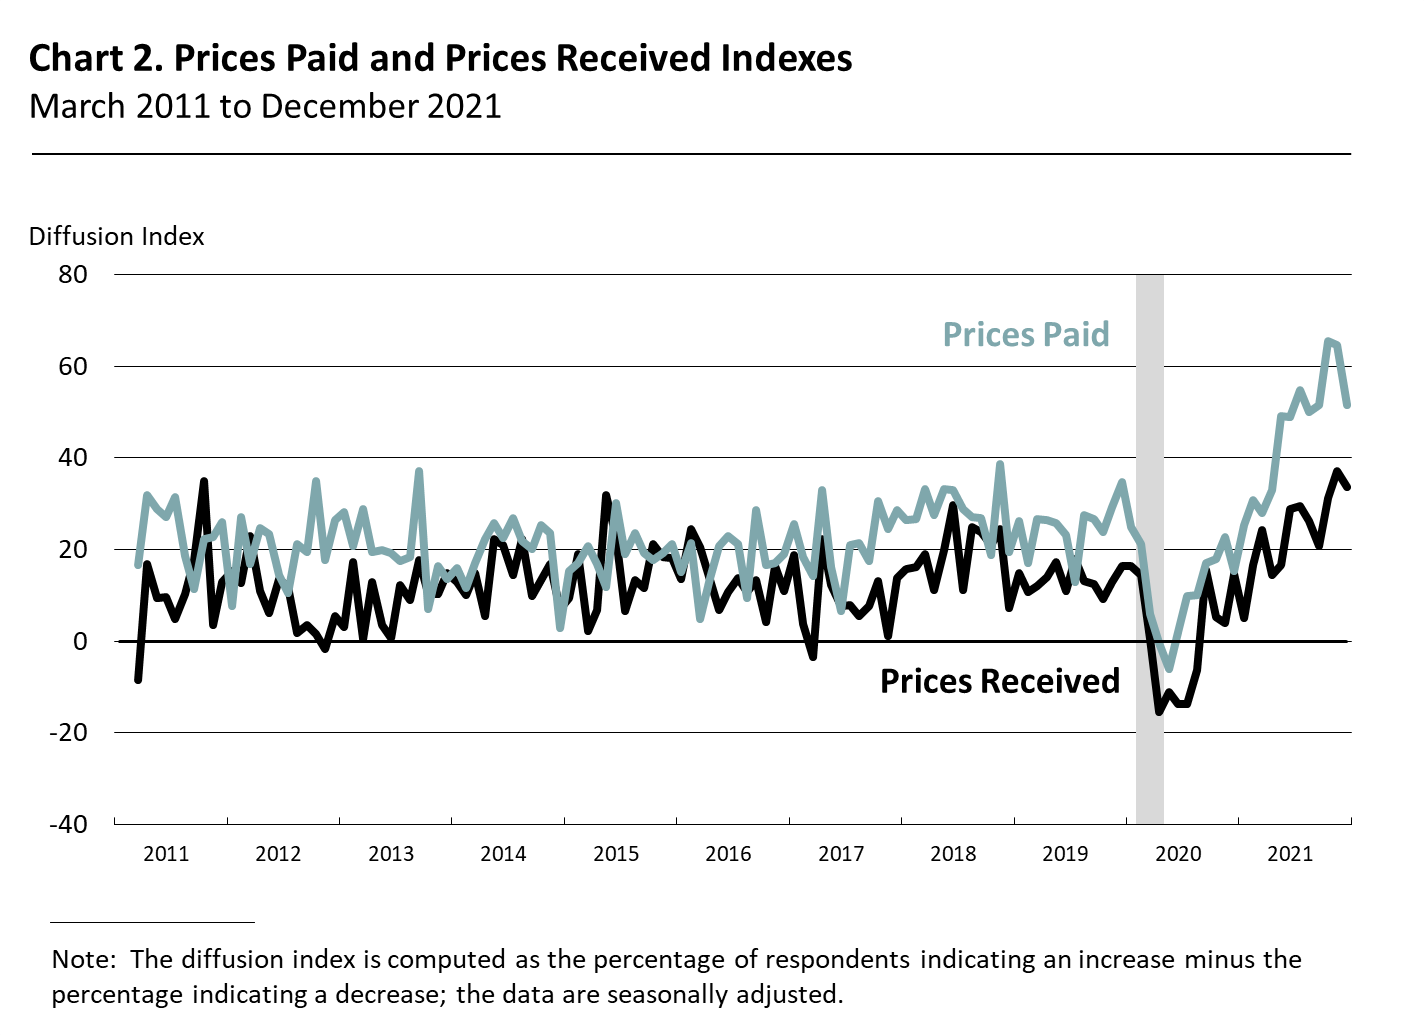
The prices paid index remained elevated but declined 13 points this month to 51.5 (see Chart 2). More than 54 percent of the firms reported increases, 3 percent reported decreases, and 26 percent of the firms reported stable input prices. Regarding prices for the firms' own goods and services, the prices received index fell 4 points to 33.6 in December. Almost 34 percent of the firms reported increases in prices received, while no firms reported decreases. Nearly 51 percent of the firms reported no change in prices for their own goods and services.
Firms Report Higher Sales/Revenues and Labor Issues
In this month's special questions, the firms were asked to estimate their total sales/revenues growth for the fourth quarter ending this month compared with the third quarter of 2021. The share of firms reporting expected increases in fourth-quarter sales/revenues (54 percent) was greater than the share reporting decreases (14 percent), with a median response of an increase of 0 to 5 percent. Among the factors constraining current business operations, 50 percent of the firms reported labor issues, 40 percent reported supply chain issues, and 33 percent reported COVID-19 mitigation measures.
Future Indicators Remain Positive
Both future activity indexes declined but continue to suggest that the respondents expect overall improvement in nonmanufacturing activity over the next six months. The diffusion index for future activity at the firm level fell 12 points to 54.6 this month, reversing its improvement last month. Nearly 63 percent of the firms expect an increase in activity at their firms over the next six months, compared with 8 percent that expect decreases. The future regional activity index fell 13 points to 41.5.
Summary
Responses to this month's Nonmanufacturing Business Outlook Survey suggest continued growth in nonmanufacturing activity in the region. The indicators for current general activity and sales/revenues declined but remained positive. The full-time and part-time employment indexes decreased slightly, and the prices paid and prices received indexes remain at high levels. The future activity indexes suggest that respondents expect improvement at their firms and in the region over the next six months.
Special Questions (December 2021)
|
1. How will your firm's total sales/revenues for the fourth quarter of 2021 compare with those of the third quarter? |
| An increase of: |
% of firms |
Subtotals |
| 20% or more |
7.9 |
% of firms reporting an increase: 54.0 |
| 15-20% |
4.8 |
| 10-15% |
4.8 |
| 5-10% |
11.1 |
| 0-5% |
25.4 |
| No change |
31.8 |
|
| A decline of: |
|
|
| 0-5% |
3.2 |
% of firms reporting a decrease: 14.4 |
| 5-10% |
6.4 |
| 10-15% |
0.0 |
| 15-20% |
3.2 |
| 20% or more |
1.6 |
|
2. Have any of the factors below acted as constraints on business operations this quarter?* |
|
% of Reporters |
| Labor issues |
50.0 |
| Supply chain issues |
39.5 |
| COVID-19 mitigation measures (e.g., reduced operations, distancing) |
32.9 |
| Other factors |
7.9 |
| *Percentages will not add to 100 because more than one factor could be selected. |
Summary of Returns (December 2021)