Manufacturing activity in the region continued to grow, according to the firms responding to the March Manufacturing Business Outlook Survey. The survey's indicators for general activity, shipments, and new orders all rose after declining last month. The employment index and both price indexes climbed higher and remain elevated. The survey's future general activity, new orders, and shipments indexes moderated, but the surveyed firms remained generally optimistic about growth over the next six months.
Current Indicators Improve
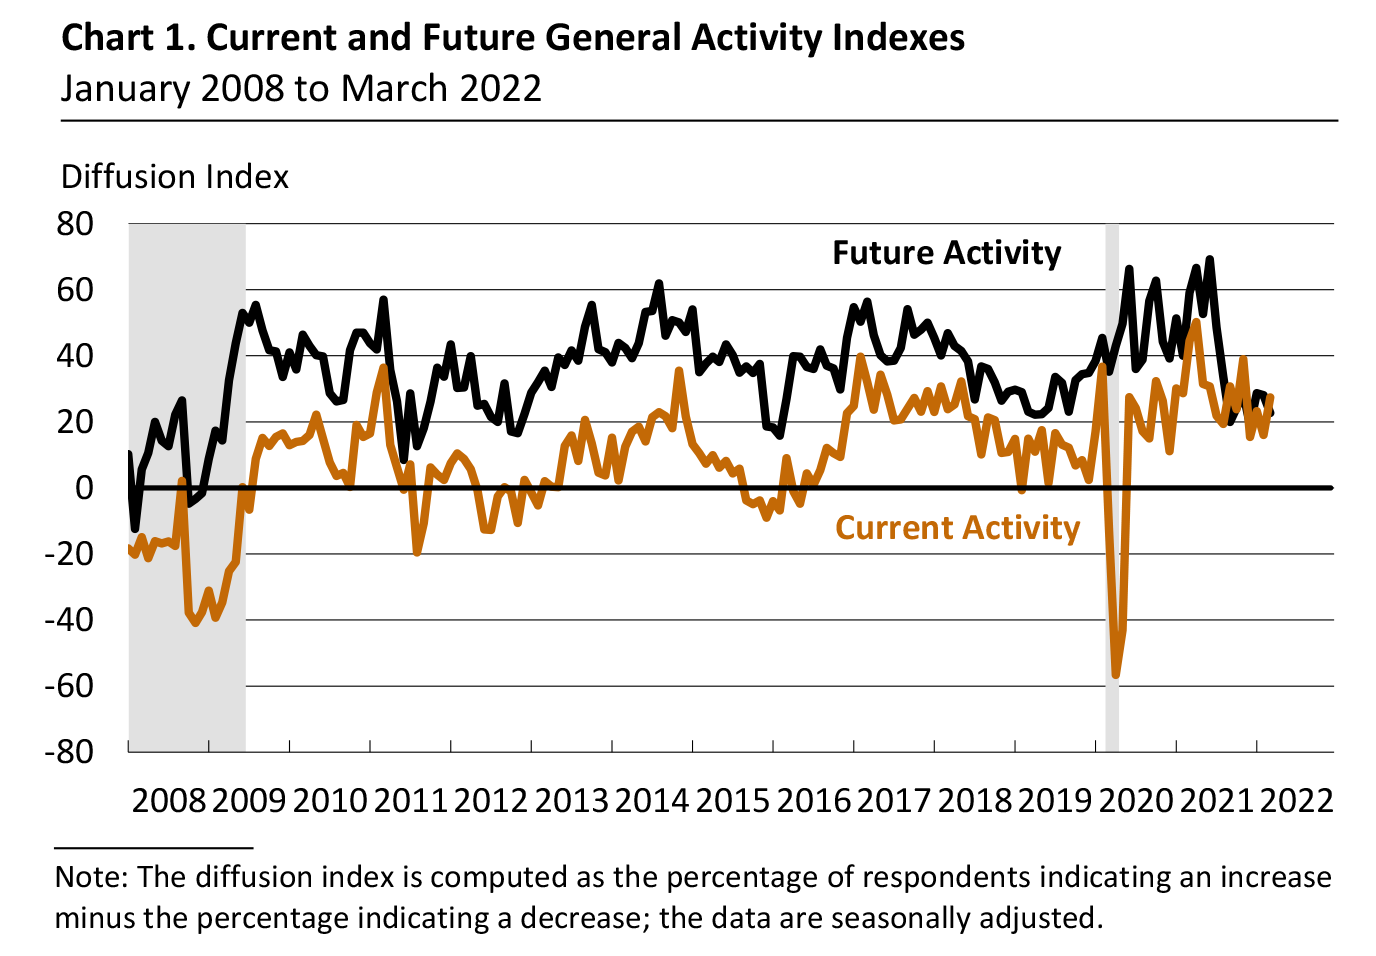
The diffusion index for current general activity rose 11 points to 27.4 this month, its highest reading since November 2021 (see Chart 1). More than 40 percent of the firms reported increases (up from 26 percent last month) in current activity this month, while 13 percent reported decreases (up from 10 percent). The current shipments and new orders indexes also rose to their highest readings since November 2021: The current shipments index increased 17 points to 30.2, and the new orders index increased 12 points to 25.8.
On balance, the firms continued to report increases in employment, and the employment index rose to 38.9, its highest reading ever. Almost 44 percent of the firms reported increases in employment, compared with 5 percent that reported decreases; 48 percent reported no change. The average workweek index rose 11 points, to 21.4.
Price Increases Become More Widespread
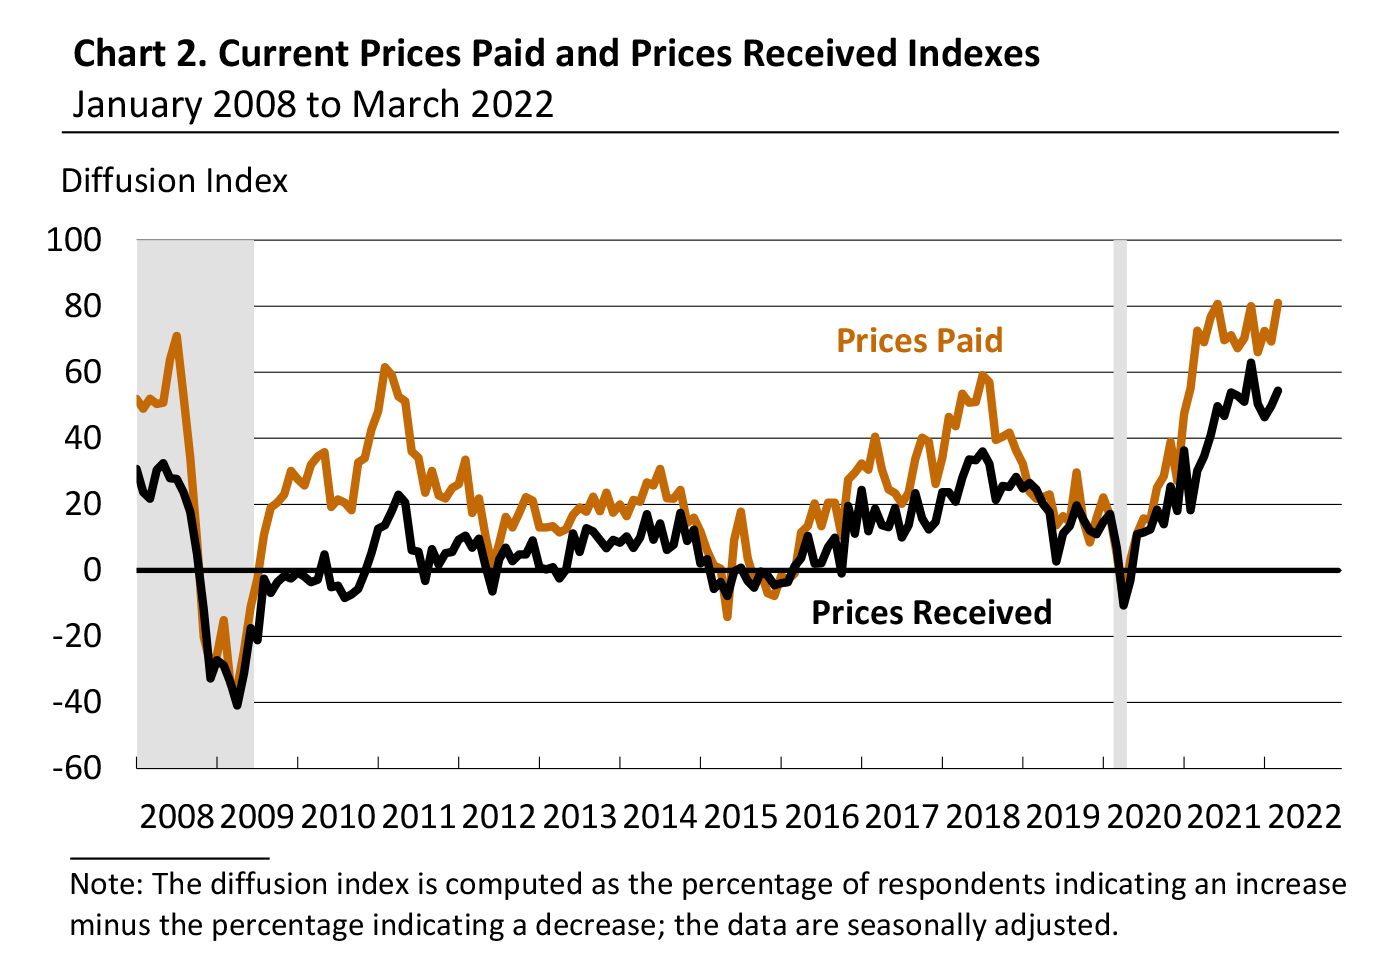
The indicators for prices paid and prices received continue to indicate widespread price increases and moved higher this month. The prices paid index climbed 12 points to 81.0, its highest reading since June 1979 (see Chart 2). More than 87 percent of the firms reported increases in input prices, while 6 percent reported decreases; 7 percent of the firms reported no change. The current prices received index increased 5 points to 54.4. Nearly 57 percent of the firms reported increases in prices received for their own goods this month, 2 percent reported decreases, and 38 percent reported no change.
Firms Report Higher Production and Capacity Utilization
In this month's special questions, the firms were asked to estimate their total production growth for the first quarter ending this month compared with the fourth quarter of 2021. The share of firms reporting expected increases in first-quarter production (71 percent) was greater than the share reporting decreases (12 percent).
The firms were also asked about their current capacity utilization rate for the current quarter and one year ago as well as factors constraining capacity utilization in the current quarter. Relative to last year, a higher share of firms reported a utilization rate of 90 to 100 percent (17 percent vs. 3 percent), and a smaller share reported a rate of 60 to 70 percent (10 percent vs. 28 percent). However, the median current capacity utilization rate reported among the responding firms was 70 to 80 percent, the same as the rate reported for one year ago.
Regarding factors constraining capacity utilization in the current quarter, nearly all firms reported labor supply and supply chains as constraints to some degree, with 56 percent of the firms indicating that supply chains significantly constrained utilization. Looking ahead over the next three months, 44 percent of the respondents expect the impact of supply chains to worsen, while 23 percent expect it to improve. Nearly two-thirds of the firms reported the energy markets were not acting as a constraint in the current quarter; however, just over two-thirds expected the impacts from energy markets to worsen over the next three months.
Future Indicators Remain Positive
The diffusion index for future general activity decreased 5 points to 22.7 but remains slightly above its average over the past seven months (see Chart 1). Almost 41 percent of the firms expect activity to increase over the next six months, while 18 percent expect activity to decrease. The future new orders index declined 3 points, and the future shipments index fell 14 points. The firms continued to expect overall increases in employment over the next six months, and the future employment index rose 4 points to 40.7. Nearly 42 percent of the firms expect to increase employment in their manufacturing plants over the next six months; only 1 percent anticipate employment declines.
Summary
Responses to the March Manufacturing Business Outlook Survey suggest continued expansion for the region's manufacturing sector. The indicators for current activity, new orders, and shipments rose from their February readings, and the employment index reached an all-time high. The price indexes remain elevated and continue to suggest widespread increases in prices. The survey's future indexes indicate that respondents continue to expect growth over the next six months.
Special Questions (March 2022)
1. How will your firm's total production for the first quarter of 2022 compare with that of the fourth quarter of 2021?
| An increase of: |
% of firms |
Subtotals |
| 10% or more |
22.0 |
% of firms reporting an increase: 70.7 |
| 5-10% |
39.0 |
| 0-5% |
9.8 |
| No change |
17.1 |
|
| A decline of: |
|
|
| 0-5% |
4.9 |
% of firms reporting a decrease: 12.2 |
| 5-10% |
0.0 |
| 10% or more |
7.3 |
2. Which of the following best characterizes your plant's percentage capacity utilization currently (2022:Q1) and one year ago (2021:Q1)?
Capacity Utilization Rate |
2022:Q1
% of Reporters |
2021:Q1
% of Reporters |
| Less than 30% |
0.0 |
2.5 |
| 30-40% |
0.0 |
5.0 |
| 40-50% |
4.9 |
2.5 |
| 50-60% |
9.8 |
10.0 |
| 60-70% |
9.8 |
27.5 |
| 70-80% |
36.6 |
35.0 |
| 80-90% |
22.0 |
15.0 |
| 90-100% |
17.1 |
2.5 |
| Median Utilization Rate |
70-80 |
70-80 |
3. In the current quarter, to what degree have the following factors acted as constraints on capacity utilization?
| |
Not at all
(%)
|
Slightly
(%)
|
Moderately
(%) |
Significantly
(%) |
| COVID-19 mitigation measures |
53.7 |
29.3 |
9.8 |
7.3 |
| Energy markets |
62.5 |
7.5 |
15.0 |
15.0 |
|
Financial capital
|
77.5 |
20.0 |
2.5 |
0.0 |
|
Labor supply
|
7.3 |
14.6 |
39.0 |
39.0 |
| Supply chains |
4.9 |
9.8 |
29.3 |
56.1 |
| Other factors |
58.8 |
0.0 |
23.5 |
17.6 |
4. Over the next three months, how do you expect the impacts of the following factors as constraints on capacity utilization to change?
| |
Worsen
(%)
|
Stay the same
(%)
|
Improve
(%)
|
| COVID-19 mitigation measures |
2.6 |
43.6 |
53.8 |
| Energy markets |
67.5 |
32.5 |
0.0 |
|
Financial capital
|
15.8 |
84.2 |
0.0 |
|
Labor supply
|
27.5 |
47.5 |
25.0 |
| Supply chains |
43.6 |
33.3 |
23.1 |
| Other factors |
14.3 |
78.6 |
7.1 |