Research >> Economics

Philadelphia Fed NonManufacturing Survey Suggest Activity moderation continued in December


Firms responding to the December Nonmanufacturing Business Outlook Survey indicated a continued moderation in business activity. The survey's current indicator for general activity at the firm level held steady at a low but positive reading. However, the indexes for new orders and sales/revenues remained negative, and the full-time employment index declined into negative territory. The respondents continued to expect overall improvement in conditions over the next six months.

Firms Report Overall Declines in Sales/Revenues

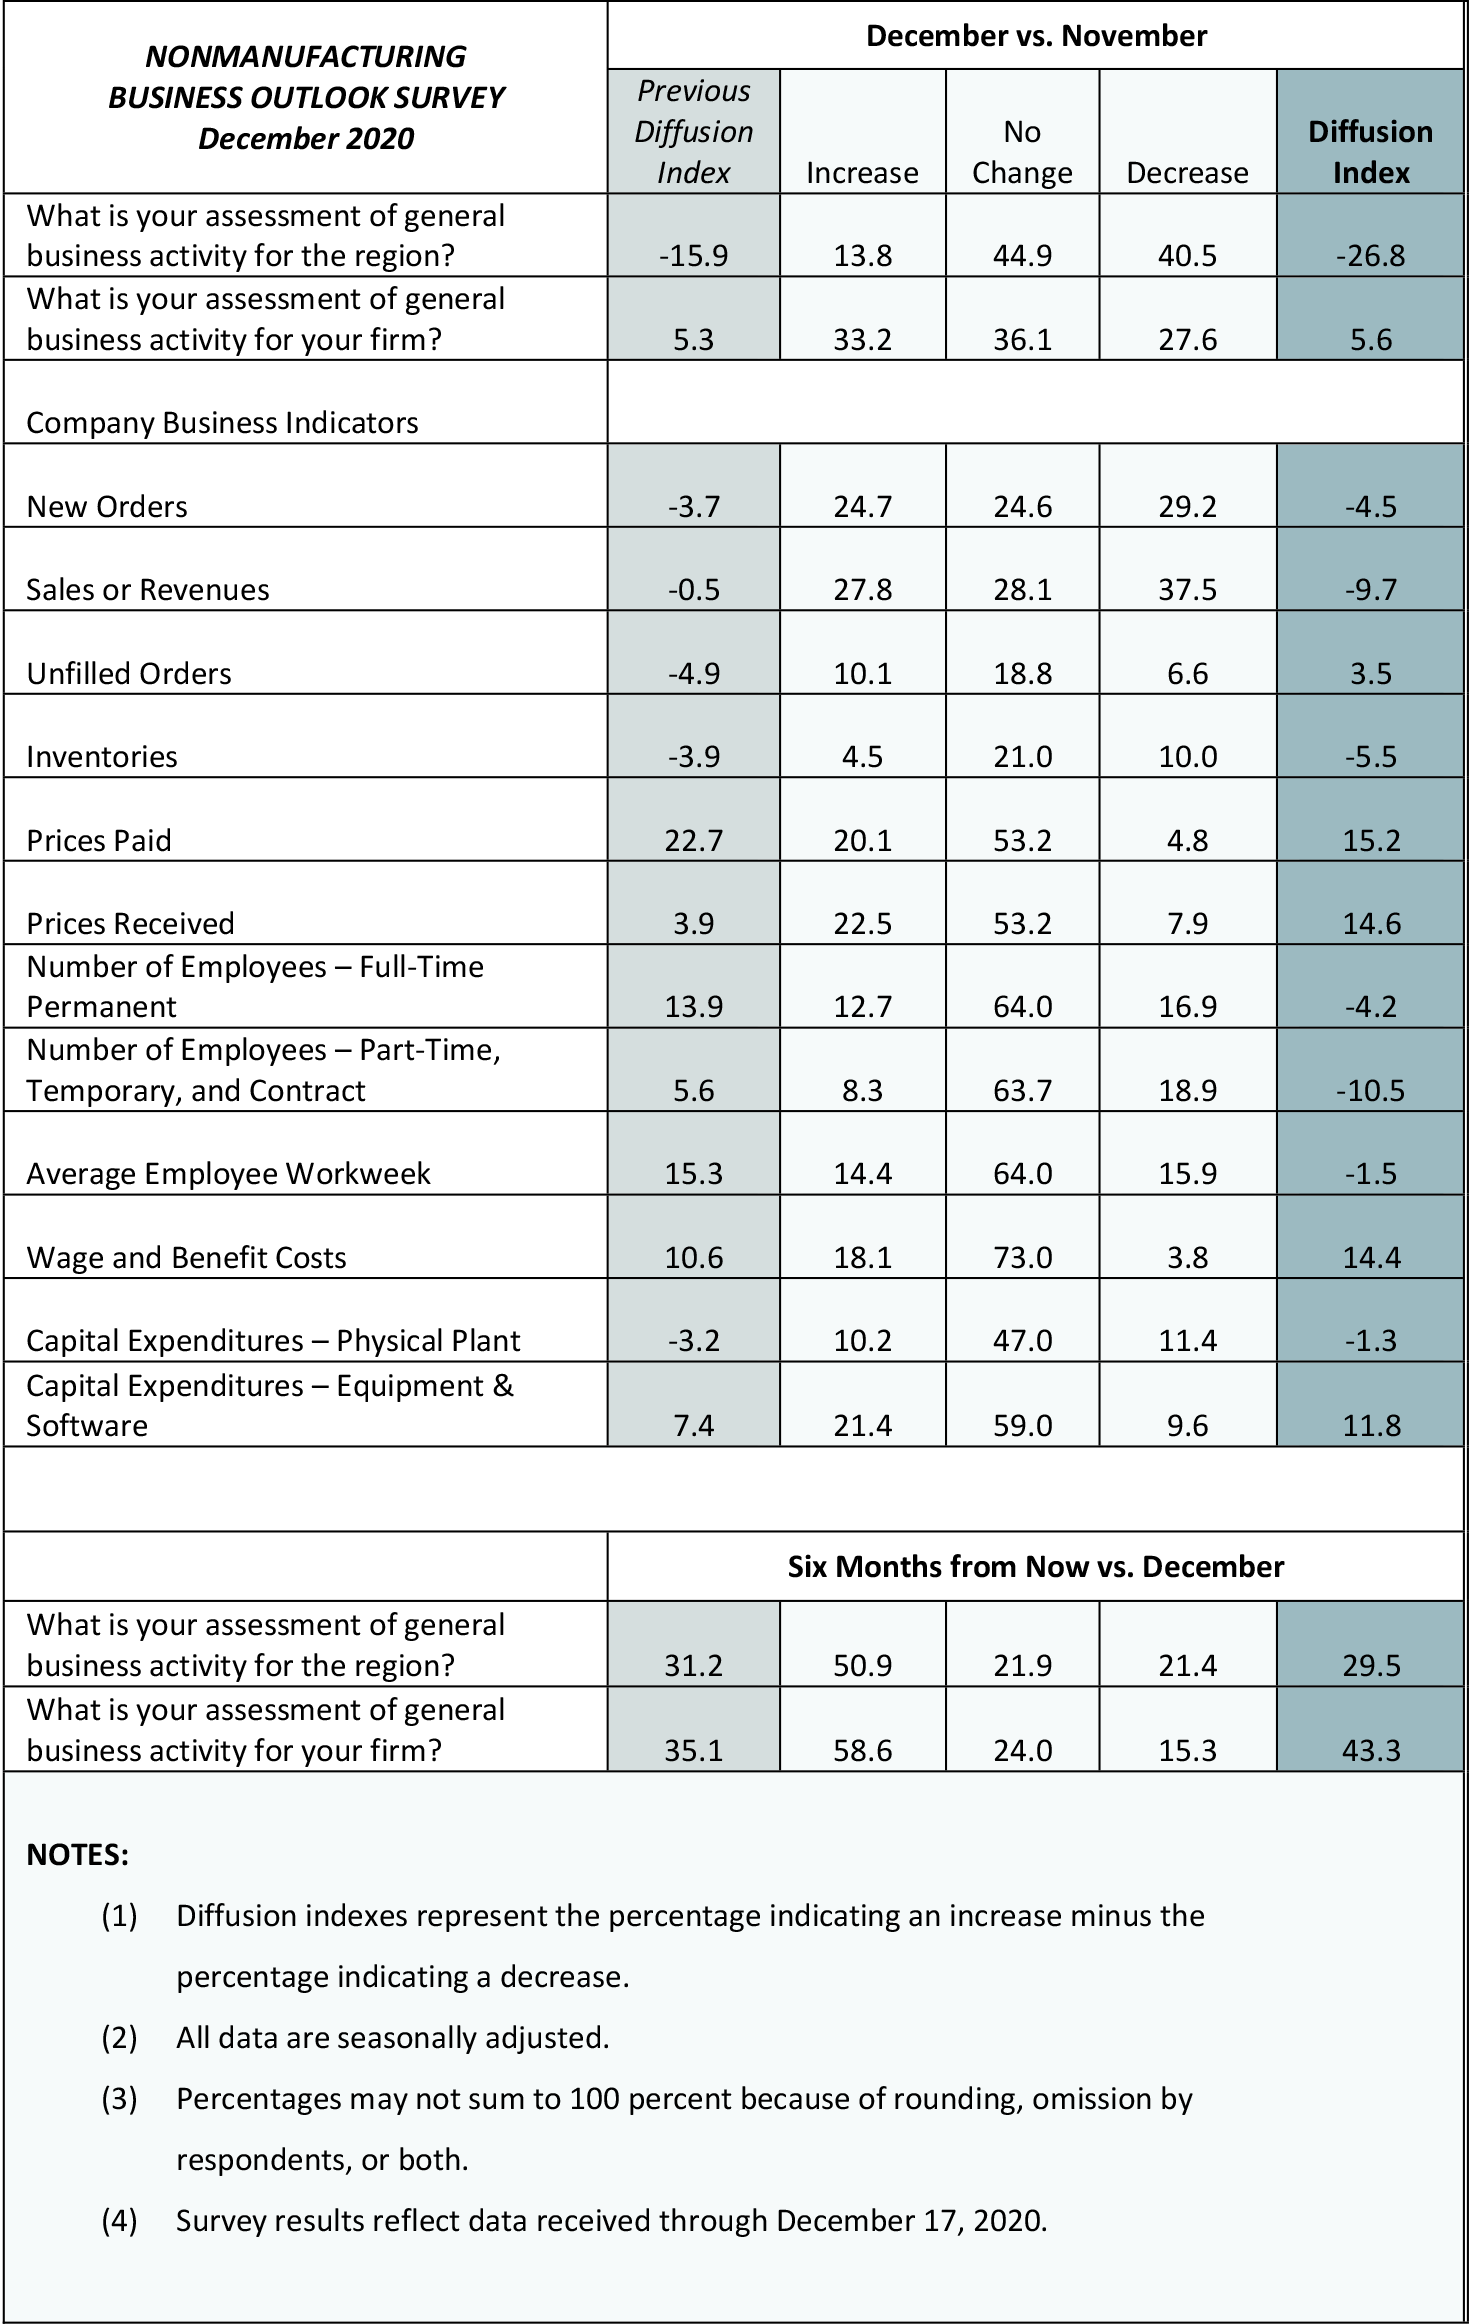
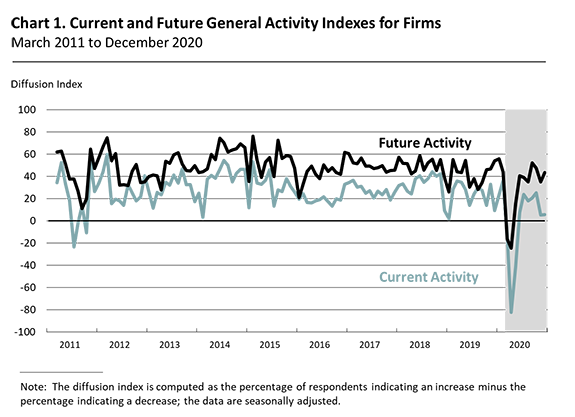
The diffusion index for current general activity at the firm level held steady at 5.6 in December, its seventh consecutive positive reading since reaching record lows in the spring (see Chart 1). Over 33 percent of the firms reported increases, while 28 percent reported decreases. The new orders index decreased for the fifth consecutive month, edging down 1 point to -4.5 in December. The share of firms reporting decreases (29 percent) exceeded the share of firms reporting increases (25 percent). The sales/revenues index fell 9 points to -9.7 in December. Nearly 28 percent of the firms reported increases in sales/revenues (down from 37 percent last month), while 38 percent reported decreases (mostly unchanged). The regional activity index fell 11 points to -26.8.

Current and Future General Activity Indexes for Firms

Employment Indicators Turn Negative

The firms reported overall decreases in full-time and part-time employment as both employment indexes registered negative readings for the first time since August. The full-time employment index decreased for the second consecutive month, falling 18 points to -4.2. Nearly 13 percent of the firms reported increases in full-time employment (down from 23 percent last month), while 17 percent reported decreases (up from 9 percent). The majority of firms reported steady full-time employment (64 percent). The part-time employment index decreased 16 points to -10.5. A majority of firms reported steady part-time employment (64 percent), while 8 percent of the firms reported increases (down from 19 percent last month) and 19 percent reported decreases (up from 14 percent). The wages and benefits indicator rose 4 points to 14.4, and the average workweek index fell 17 points to -1.5.

Firms Continue to Report Overall Price Increases

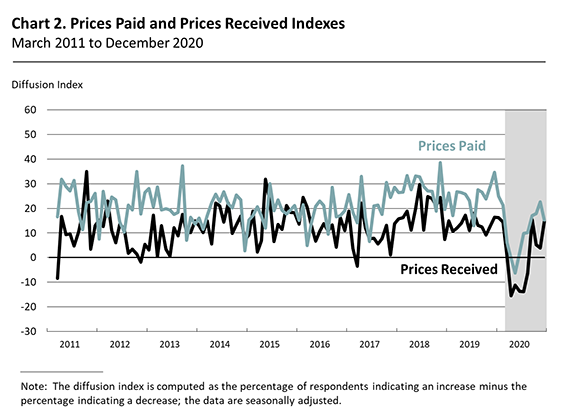
Price indicator readings suggest overall increases in prices for inputs and prices for the firms' own goods and services. The prices paid index declined 8 points to 15.2 in December (see Chart 2). Price increases for the firms' own goods and services were more widespread this month. The prices received index increased for the first time since September, rising 11 points to 14.6 in December. Nearly 23 percent of the firms reported increases for their own goods, while 8 percent reported decreases.

Prices Paid and Prices Received Indexes

Firms Continue to Anticipate Growth

Both future activity indexes suggest continued optimism about growth over the next six months. The diffusion index for future activity at the firm level increased 8 points to a reading of 43.3 this month (see Chart 1). Nearly 59 percent of the firms expect an increase in activity at their firms over the next six months, compared with 15 percent that expect decreases. The future regional activity index edged down 2 points to 29.5 in December.

Summary

Responses to this month's Nonmanufacturing Business Outlook Survey suggest a continued moderation in nonmanufacturing activity in the region. The indicator for firm-level general activity remains positive but low, but the indicators for new orders, sales/revenues, and full-time employment were all negative. The future activity indexes suggest that respondents expect improvement at their firms and in the region over the next six months.

Summary of Returns (December 2020)

Summary of Returns


Click to Link


Posted: December 22, 2020 Tuesday 08:30 AM


Tags - Research
ADP EMPLOYMENT
BEIGE BOOK
BUSINESS BAROMETER
BUSINESS INVENTORIES
CASE-SHILLER
CEO CONFIDENCE
CHALLENGER LAYOFFS
CHICAGO FED MIDWEST MFG
CHICAGO FED NATL ACTIVITY
CHICAGO PMI
CONSTRUCTION SPENDING
CONSUMER CONFIDENCE
CONSUMER CREDIT
CPI
CURRENT ACCOUNT
DURABLE GOODS
EMPLOYMENT COST INDEX
EMPLOYMENT TRENDS INDEX
EXISTING HOME SALES
FACTORY ORDERS
FOMC STMT
FOMC
GDP
HELP WANTED HWOL
HOUSING STARTS
ICSC CHAIN STORE
IMPORT PRICE INDEX
INDUSTRIAL PRODUCTION
INTERNATIONAL TRADE
ISM MFG
ISM NON-MFG
JOB OPENINGS
JOBLESS CLAIMS
KANSAS CITY FED MFG
LEADING INDEX
MASS LAYOFFS
MICH CONSUMER CONFIDENCE
MORTGAGE APPS
NAHB INDEX
NAPM-NY
NBER
NEW HOME SALES
NEW YORK FED MFG
NFIB OPTIMISM INDEX
NONFARM EMPLOYMENT
PAYCHEX-IHS SMALL JOBS
PENDING HOME SALES
PERSONAL INCOME
PHILA FED FORECASTERS
PHILA FED MFG
PHILA FED NON-MFG
PPI
PRODUCTIVITY GROWTH
REAL HOURLY EARNINGS
RETAIL SALES
RICHMOND FED MFG
TEXAS FED MFG
TREASURY INTL CAPITAL
WHOLESALE INVENTORIES
Archives
Apr 2024
Mar 2024
Feb 2024
Jan 2024
Dec 2023
Nov 2023
Oct 2023
Sep 2023
Aug 2023
Jul 2023
Jun 2023
May 2023
Apr 2023
Mar 2023
Feb 2023
Jan 2023
Dec 2022
Nov 2022
Oct 2022
Sep 2022
Aug 2022
Jul 2022
Jun 2022
May 2022
Apr 2022
Mar 2022
Feb 2022
Jan 2022
Dec 2021
Nov 2021
Oct 2021
Sep 2021
Aug 2021
Jul 2021
Jun 2021
May 2021
Apr 2021
Mar 2021
Feb 2021
Jan 2021
Dec 2020
Nov 2020
Oct 2020
Sep 2020
Aug 2020
Jul 2020
Jun 2020
May 2020
Apr 2020
Mar 2020
Feb 2020
Jan 2020
Dec 2019
Nov 2019
Oct 2019
Sep 2019
Aug 2019
Jul 2019
Jun 2019
May 2019
Apr 2019
Mar 2019
Feb 2019
Jan 2019
Dec 2018
Nov 2018
Oct 2018
Sep 2018
Aug 2018
Jul 2018
Jun 2018
May 2018
Apr 2018
Mar 2018
Feb 2018
Jan 2018
Dec 2017
Nov 2017
Oct 2017
Sep 2017
Aug 2017
Jul 2017
Jun 2017
May 2017
Apr 2017
Mar 2017
Feb 2017
Jan 2017
Dec 2016
Nov 2016
Oct 2016
Sep 2016
Aug 2016
Jul 2016
Jun 2016
May 2016
Apr 2016
Mar 2016
Feb 2016
Jan 2016
Dec 2015
Nov 2015
Oct 2015
Sep 2015
Aug 2015
Jul 2015
Jun 2015
May 2015
Apr 2015
Mar 2015
Feb 2015
Jan 2015
Dec 2014
Nov 2014
Oct 2014
Sep 2014
Aug 2014
Jul 2014
Jun 2014
May 2014
Apr 2014
Mar 2014
Feb 2014
Jan 2014
Dec 2013
Nov 2013
Oct 2013
Sep 2013
Aug 2013
Jul 2013
Jun 2013
May 2013
Apr 2013
Mar 2013
Feb 2013
Jan 2013
Dec 2012
Nov 2012
Oct 2012
Sep 2012
Aug 2012
Jul 2012
Jun 2012
May 2012
Apr 2012
Mar 2012
Feb 2012
Jan 2012
Dec 2011
Nov 2011
Oct 2011
Sep 2011
Aug 2011
Jul 2011
Jun 2011
May 2011
Apr 2011
Mar 2011
Feb 2011
Jan 2011
Dec 2010
Nov 2010
Oct 2010
Sep 2010
Aug 2010
Jul 2010
Jun 2010
May 2010
Apr 2010
Mar 2010
Feb 2010
Jan 2010
Dec 2009
Nov 2009
Oct 2009
Sep 2009
Aug 2009
Jul 2009
Jun 2009
May 2009
Apr 2009
Mar 2009
Feb 2009
Jan 2009
Dec 2008
Nov 2008
Oct 2008
Sep 2008
Aug 2008


National Association for Business Economics
NABE

Founded in 1920, the National Bureau of Economic Research is a private, nonprofit, nonpartisan research organization dedicated to promoting a greater understanding of how the economy works.

CFA Institute

Quick Links
Barron's Online
Bloomberg
CNBC
CNBC TV Live
CNet Investor
Financial Times (UK)
Forbes
Kudlow Podcast
MSNBC TV Live
NBC News
NY Times
The Economist
TheStreet.com
Wall St Journal
Dismal Scientist
Dr. Ed Yardeni
FRED Graph
Lawrence Kudlow
GDPNow
NABE
ABC News
CNNfn
Institutional Investor
MarketWatch
Cash Prices - WSJ.com
Dollar Index
Dr. Jeremy Siegel
Market Map
NY RBOB Gas
PriceStats
Rig Count
Shadow Fed - SOMC
The Billion Prices Project
BankStocks.com
Dow Jones Indices
Morningstar
SP Indices
Mt Washington Observatory
Weather.com
Yahoo!!