Manufacturing activity in the region continued to decline overall, according to the firms responding to the January Manufacturing Business Outlook Survey. The survey's indicators for general activity, new orders, and shipments rose from last month, but the former two remained negative. The employment index rebounded. The firms reported overall increases in prices: The prices received index remained elevated, while the prices paid index returned to average readings. Most future indicators were positive, but expectations for growth over the next six months were not widespread.
Current Indicators Remain Weak
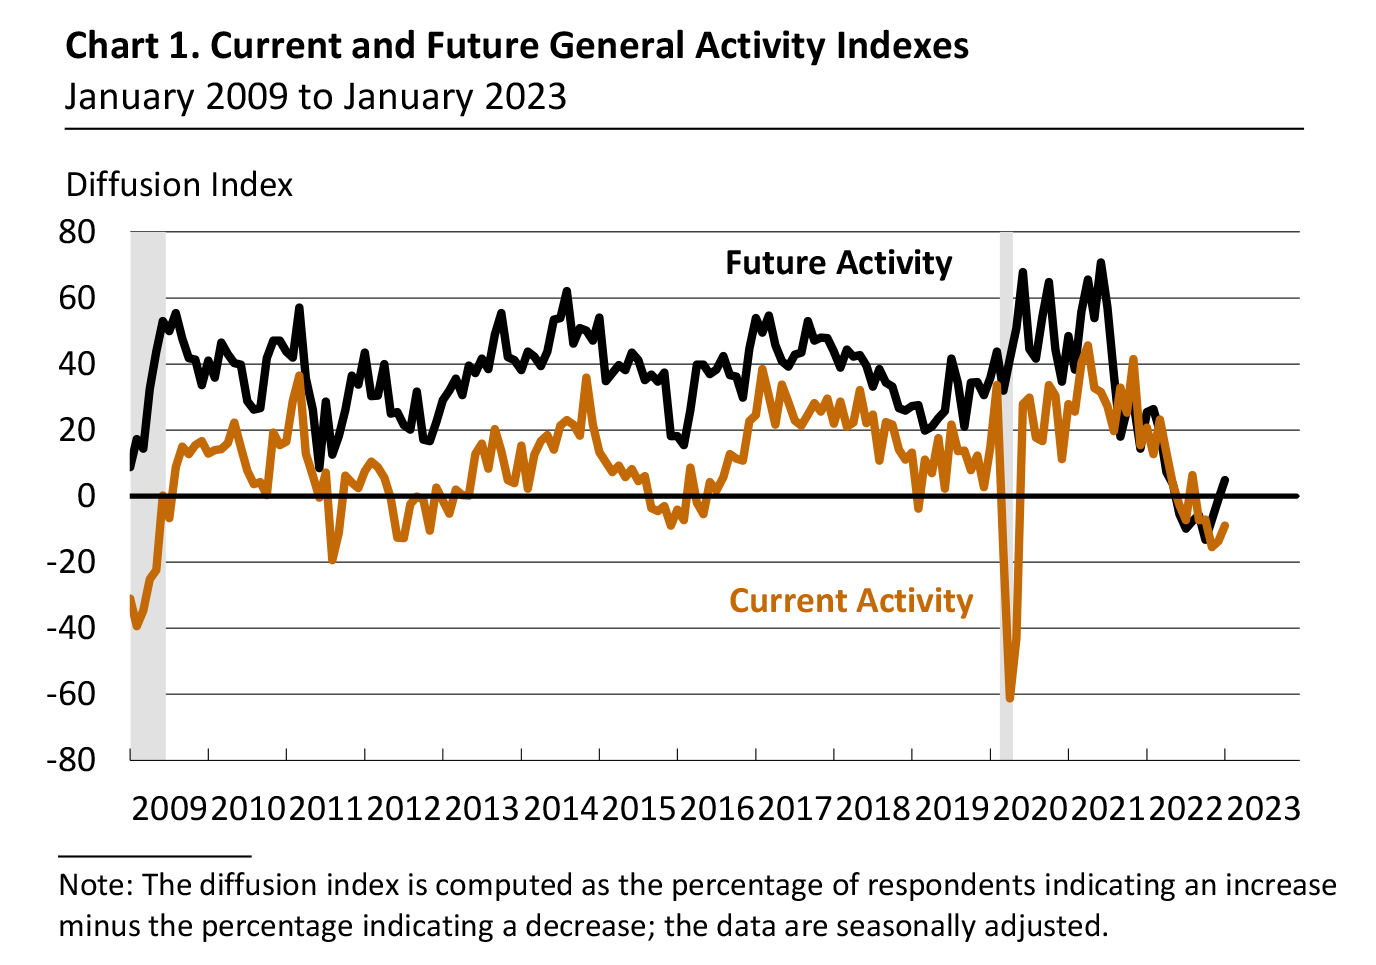
The diffusion index for current general activity rose from a revised reading of -13.7 in December to -8.9 in January (see Chart 1), its fifth consecutive negative reading and seventh negative reading in the past eight months.* More than 33 percent of the firms reported declines in activity, exceeding the 24 percent that reported increases. The current new orders index rose 11 points but remained negative at -10.9, and the current shipments index climbed 12 points to 11.1 after turning negative in December. Nearly 30 percent of the firms indicated increases in shipments compared with 19 percent that indicated decreases.
On balance, the firms reported increases in employment, and the employment index improved from -0.9 in December to 10.9 this month. The majority of responding firms (65 percent) reported steady employment levels, and the share reporting increases (22 percent) exceeded the share reporting decreases (11 percent). The average workweek index also turned positive, rising from -6.6 to 4.0.
Prices Paid Index Near Long-Run Average, Prices Received Index Remains Elevated
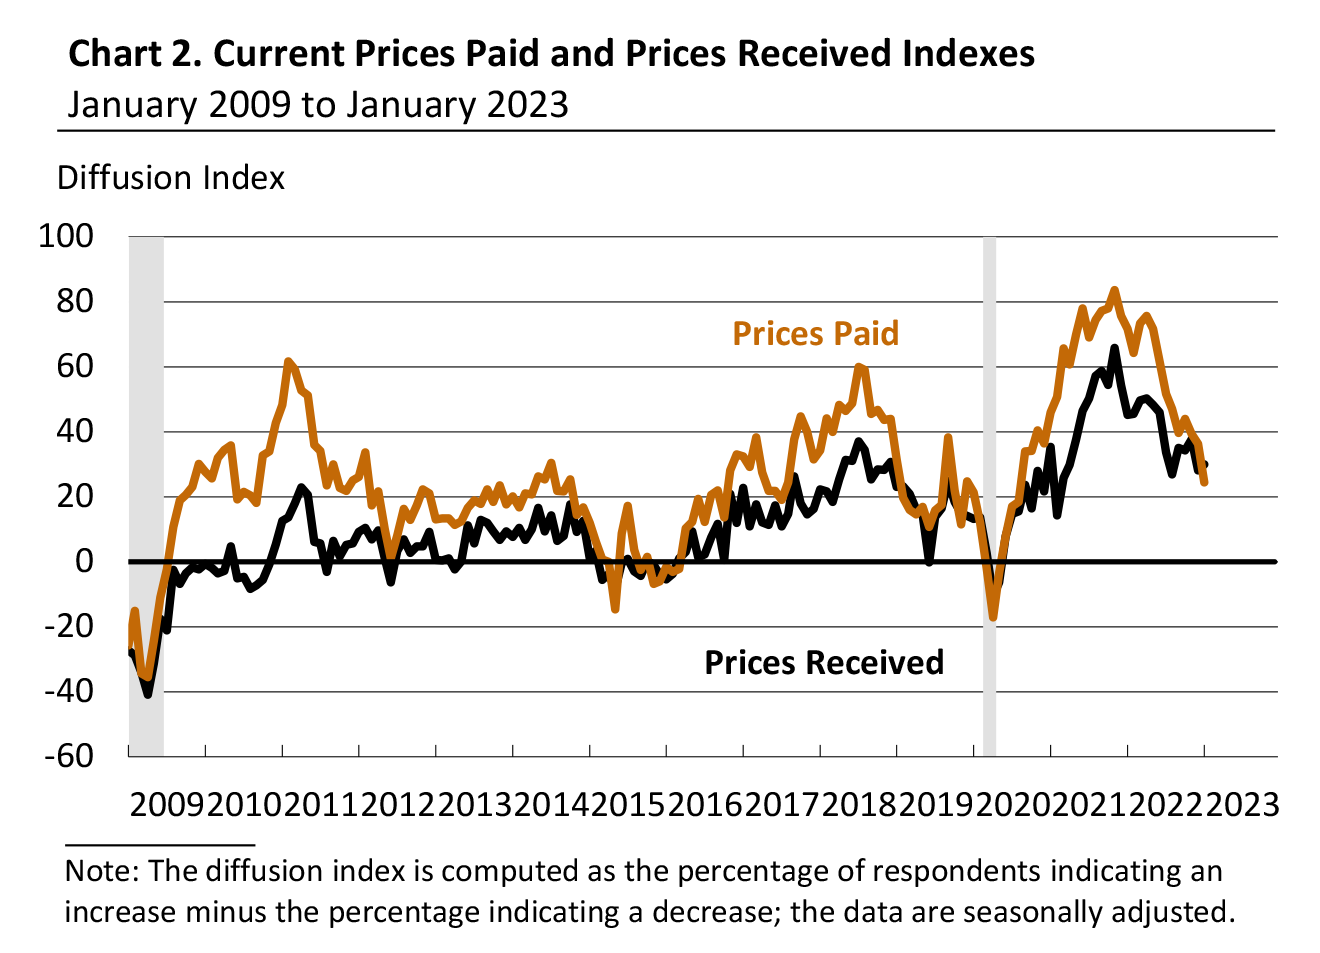
The indexes for prices paid and prices received continue to indicate overall price increases for inputs and firms' own goods. The prices paid index declined 12 points to 24.5, its lowest reading since August 2020 and slightly below its long-run average (see Chart 2). Nearly 40 percent of the firms reported increases in input prices, while 15 percent reported decreases; 45 percent of the firms reported no change. The current prices received index edged up 2 points to 29.9. Almost 39 percent of the firms reported increases in their own prices, 9 percent reported decreases, and 51 percent reported no change.
Firms Expect Smaller Cost Increases for 2023
In this month's special questions, the firms were asked about changes in their various input and labor costs over the past year and their expectations for changes in costs for the coming year. For all categories, the average percent change in costs expected for 2023 was smaller than the average percent change in costs reported for 2022. The respondents were also asked to rank the importance of various factors in setting prices. Demand for their own goods/services was the most important factor, followed by maintaining steady profit, wage and labor costs, and nonlabor costs.
Future Indicators Remain Low
The diffusion index for future general activity rose from a revised reading of -0.9 in December to 4.9 this month (see Chart 1). Almost 38 percent of the firms expect increases in future activity, 33 percent expect decreases, and 26 percent expect no change. The future new orders and future shipments indexes remained positive but declined 6 points and 11 points, respectively. The future price indexes suggest that firms expect price increases over the next six months, but both indexes declined to their lowest readings since May 2020. The future employment index fell 21 points to -1.9, its first negative reading since February 2016. The share of firms expecting declines in employment (15 percent) narrowly exceeded the share expecting increases (14 percent); most firms (67 percent) expect no changes.
Summary
Responses to the January Manufacturing Business Outlook Survey suggest continued overall declines in the region's manufacturing sector this month. The indicators for current activity and new orders improved from their December readings but remained negative. The firms continued to report overall increases in prices, and the prices received index remained elevated. The survey's future indexes suggest tempered expectations for growth over the next six months.
* The survey's annual data revisions, which incorporate updated seasonal factors, were released on January 12, 2023. The full history of revised data is available here.
Special Questions (January 2023)
1. What were the percentage changes in costs for the following categories for 2022, and what do you expect they will be for 2023?
| |
2022
(Actual) |
2023
(Expected) |
| |
Average
(%)
|
Median
(%)
|
Average
(%) |
Median
(%) |
| Energy |
9.9 |
7.5–10 |
4.6 |
2–3 |
| Other Raw Materials |
11.1 |
7.5–10 |
2.8 |
3–4 |
| Intermediate Goods |
9.5 |
7.5–10 |
3.2 |
3–4 |
| Wages |
6.6 |
5–7.5 |
3.9 |
4–5 |
| Health Benefits |
5.9 |
4–5 |
5.8 |
4–5 |
| Nonhealth Benefits |
5.0 |
3–4 |
3.8 |
3–4 |
| Wages + Health Benefits + Nonhealth Benefits |
8.6 |
5–7.5 |
6.0 |
4–5 |
| Note: Respondents selected ranges of percentage changes. The average percent change is calculated using the midpoints of the ranges of each answer option. |
2. Currently, when you think about setting the prices of your goods/services, how important to you are the following factors in making those decisions?
| |
Weighted Average*
(%)
|
| Your competitors' prices |
64 |
| The strength of demand for your most important
good(s) or service(s)
|
83 |
|
Your wages and labor costs (including benefits)
|
76 |
|
Your nonlabor costs, such as energy prices, materials prices, transportation costs, rent, etc.
|
76 |
| Maintaining steady profit margins (for price over costs) |
77 |
| Interest rates, borrowing rates, and the cost of capital |
41 |
| Problems with your supply chains, such as bottlenecks and
product shortages
|
63 |
| The overall rate of inflation in the U.S. economy,
as measured by the Consumer Price Index
|
64 |
| Other |
67 |
| * Respondents reported importance on a scale of 1 (least important) to 5 (most important). The weighted average gives 1 a weight of 0; 2 a weight of 0.25; 3 a weight of 0.5; 4 a weight of 0.75; and 5 a weight of 1. |