Manufacturing activity in the region continued to decline overall this month, according to the firms responding to the October Manufacturing Business Outlook Survey. The survey's indicators for general activity and new orders remained negative, and the shipments index was little changed at a low but positive reading. The firms continued to report higher employment on balance, and both price indexes indicate overall increases in prices. The survey's future general activity indexes suggest that the surveyed firms expect declines overall over the next six months.
Current Indicators Remain Weak
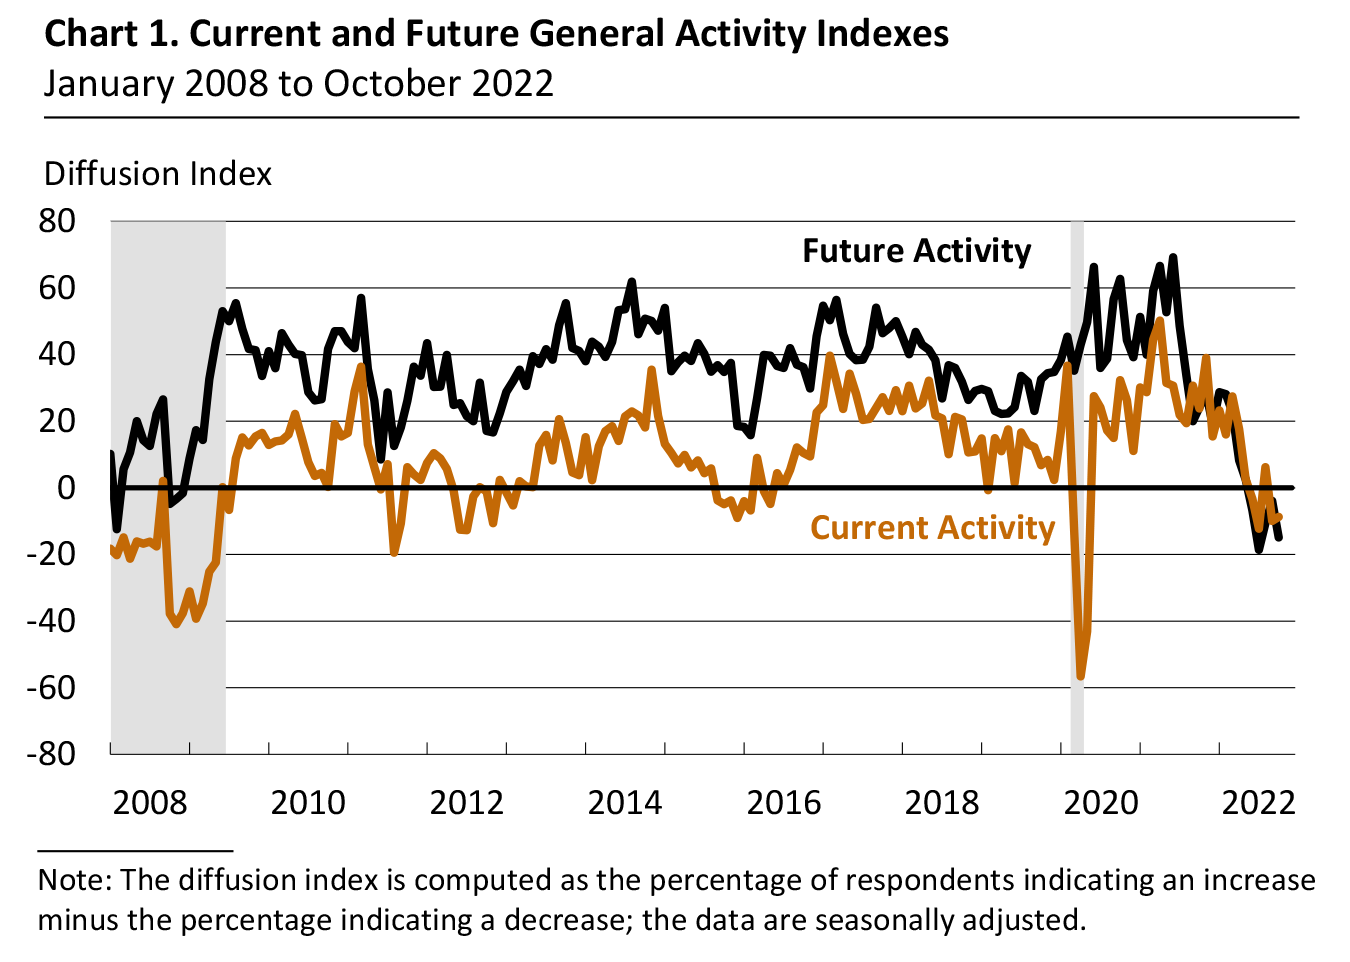
The diffusion index for current general activity edged up 1 point but remained negative at -8.7 this month (see Chart 1). This is the index's fourth negative reading in the past five months. Nearly 24 percent of the firms reported decreases in general activity this month, while 15 percent reported increases; most firms (55 percent) reported no change. The index for new orders ticked up 2 points to -15.9, and the current shipments index was essentially unchanged at 8.6 in October, its lowest reading since May 2020.
The firms continued to report increases in employment on balance. The employment index rose from 12.0 to 28.5 this month, more than offsetting its decline from last month. Just over 29 percent of the firms reported increases in employment (up from 15 percent last month), while 1 percent reported decreases (down from 3 percent); 63 percent reported steady employment levels (down from 83 percent). The average workweek index returned to positive territory, rising 14 points to 10.4.
Firms Continue to Report Price Increases
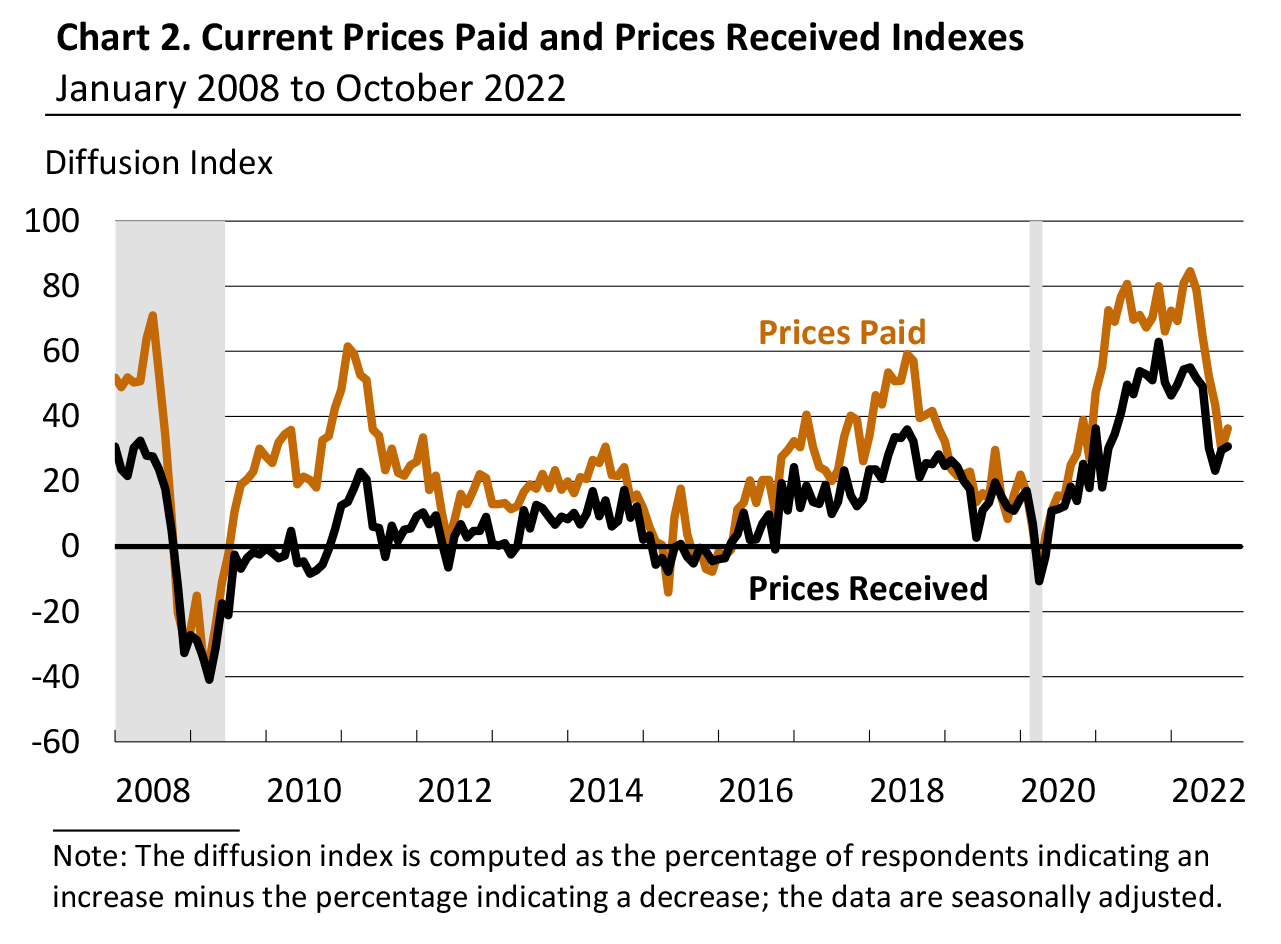
The indicators for prices paid and prices received rose modestly this month following steady declines through the summer. The prices paid index – which had fallen 55 points between April and September of this year – rose 7 points to 36.3 (see Chart 2). The percentage of firms reporting increases in input prices (46 percent) exceeded the percentage reporting decreases (10 percent); 43 percent of the firms reported no change. The current prices received index edged up 1 point to 30.8. Nearly 41 percent of the firms reported increases in prices received for their own goods this month, 10 percent reported decreases, and 44 percent reported no change.
Firms Anticipate Higher Capital Expenditures Next Year
For this month's special question, manufacturers were asked about their plans for different categories of capital expenditures next year. Although a higher share of firms expects to increase total capital spending rather than decrease total spending (37 percent versus 24 percent), the share of firms expecting to decrease spending exceeded the share of firms expecting to increase spending in four out of six categories (software, structure, computer and related hardware, and other).
Future Indicators Deteriorate
The diffusion index for future general activity fell from -3.9 to -14.9, its fifth consecutive negative reading (see Chart 1). The share of firms expecting decreases in activity over the next six months (37 percent) exceeded the share expecting increases (22 percent); roughly one-third of the firms expect no change. The future new orders index fell 23 points to -16.7, its fourth negative reading in the past five months, while the future shipments index fell 16 points but remained positive at 4.7. The firms continued to expect overall increases in employment over the next six months, but the future employment index declined 10 points to 12.2. The future capital expenditures index was essentially unchanged at 4.4.
Summary
Responses to the October Manufacturing Business Outlook Survey suggest continued overall declines in regional manufacturing conditions this month. The indicators for current activity and new orders remained negative, while the shipments index remained stable but low. The firms continued to indicate overall increases in employment, and the current price indexes continue to suggest increases in prices on balance. The survey's broad indicators for future activity deteriorated, suggesting that firms expect overall declines over the next six months.
Special Question (October 2022)
| Comparing 2023 with 2022, do you expect capital expenditures to be higher, the same, or lower for each of the following categories? |
| |
Higher
(% of reporters)
|
Same
(% of reporters)
|
Lower
(% of reporters)
|
Diffusion
Index |
| Software |
23.9 |
50.0 |
26.1 |
-2.2 |
| Noncomputer equipment |
37.0 |
45.7 |
17.4 |
19.6 |
|
Energy-saving investments
|
17.4 |
71.7 |
10.9 |
6.5 |
|
Computer and related hardware
|
17.4 |
60.9 |
21.7 |
-4.3 |
| Structure |
23.9 |
50.0 |
26.1 |
-2.2 |
| Other |
0.0 |
84.6 |
15.4 |
-15.4 |
|
Total capital spending |
37.0 |
39.1 |
23.9 |
13.0 |