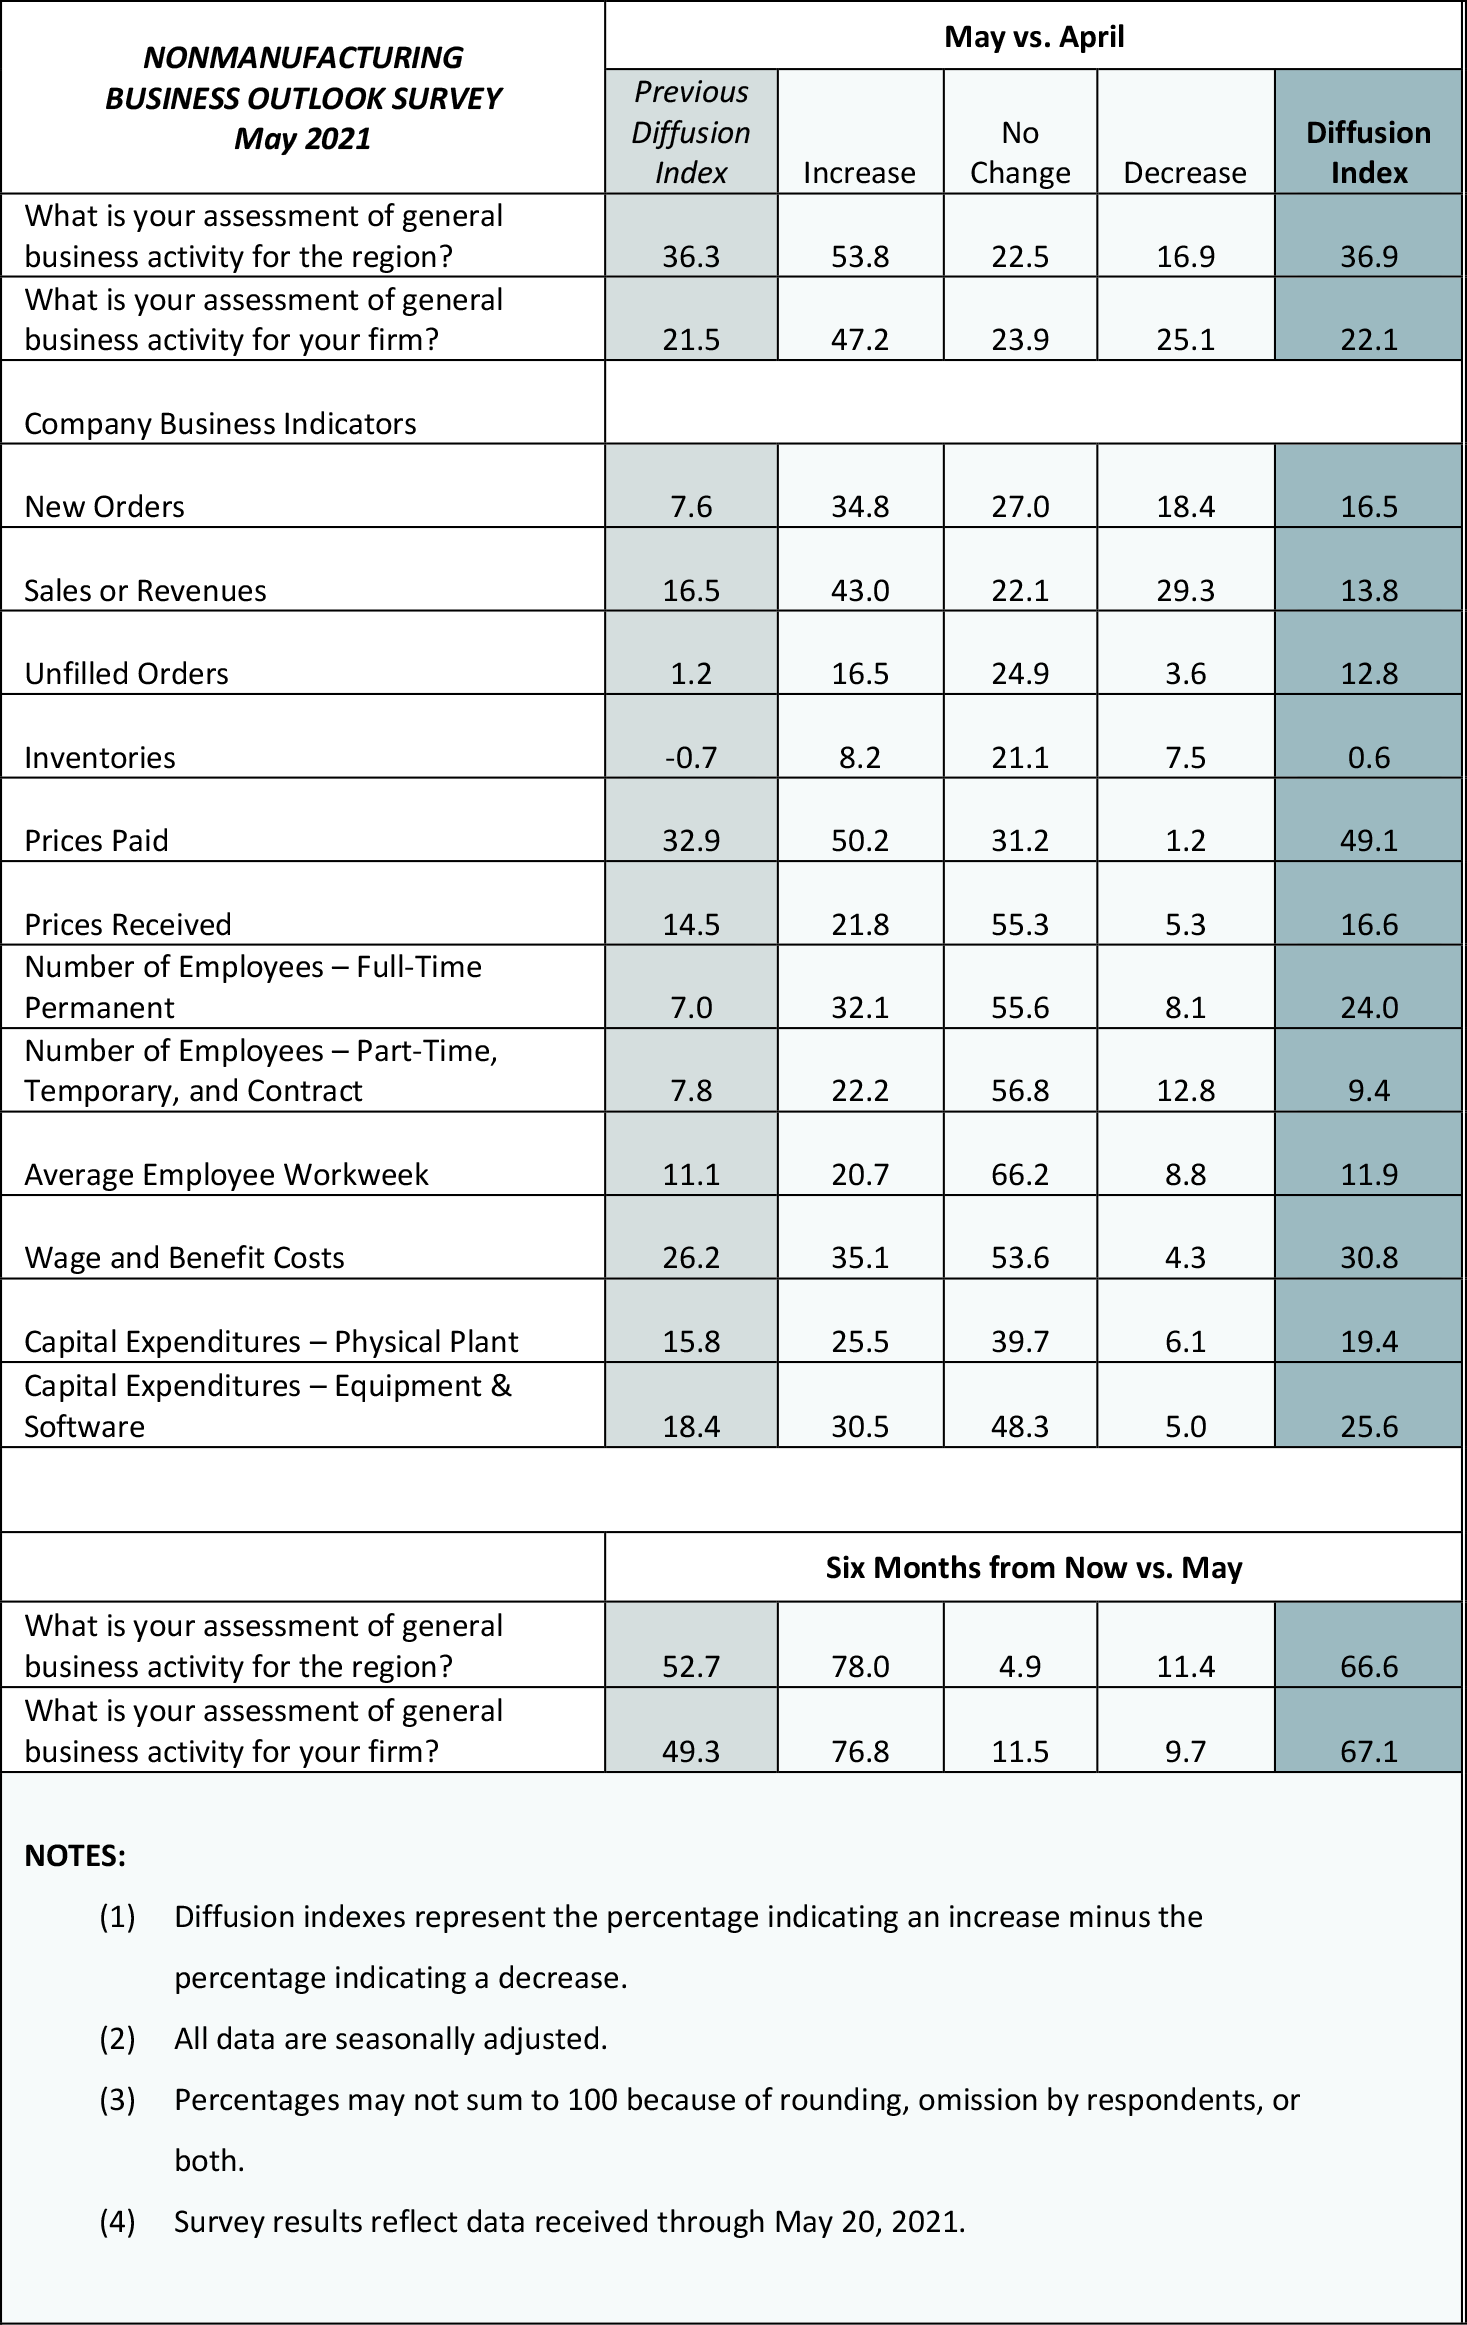
Responses to the May Nonmanufacturing Business Outlook Survey suggest continued expansion in nonmanufacturing activity in the region. The index for general activity at the firm level held mostly steady, and the index for new orders increased; however, the sales/revenues index edged down. Additionally, the survey's index for full-time employment rose notably to a reading much higher than that reported since the pandemic began. The firms continue to report increases in prices of their inputs and outputs, with the index measuring the former reaching an all-time high. The respondents indicated improved optimism about the next six months, as both future activity indexes increased.
Current Indexes Remain Positive
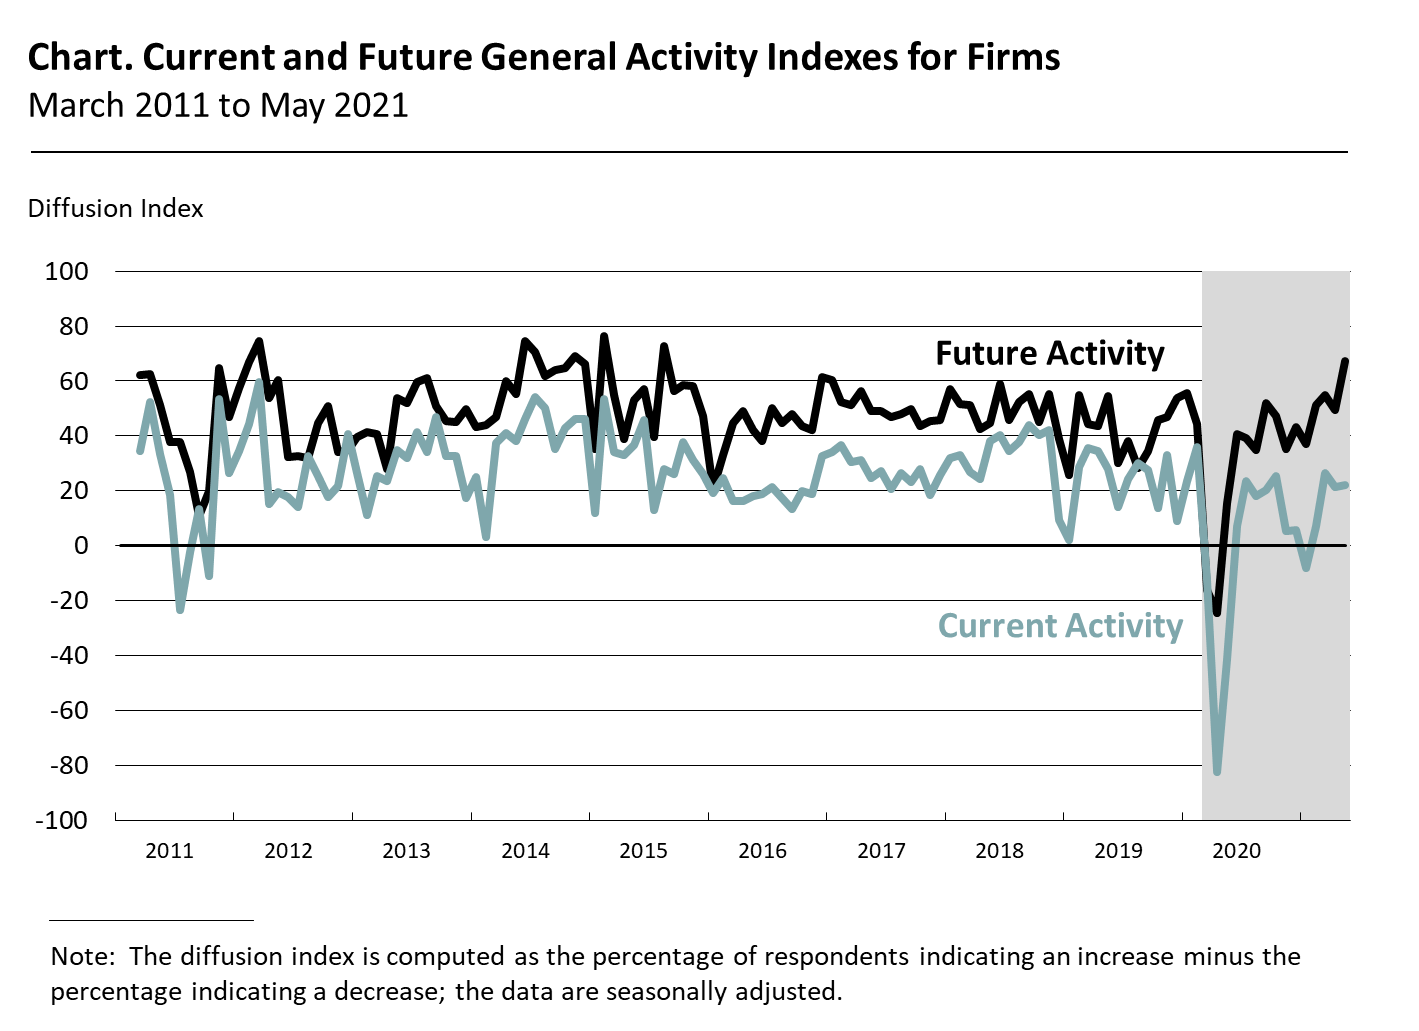
The diffusion index for current general activity at the firm level held mostly steady at 22.1 (see Chart). More than 47 percent of the firms reported increases in activity, while 25 percent reported decreases. The sales/revenues index decreased from 16.5 in April to 13.8 this month, while the new orders index rose 9 points to 16.5. The share of firms reporting increases in new orders (35 percent) exceeded the share reporting decreases (18 percent). The current regional activity index was little changed at 36.9 in May.
Full-Time Employment Index Reaches Pre-Pandemic Levels
The firms reported, on balance, increases in full- and part-time employment. The full-time employment index rose 17 points to a reading of 24.0, its highest reading since March 2019. Over 32 percent of the firms reported increases in full-time employment (up from 18 percent last month), while 8 percent reported decreases (down from 11 percent). The part-time employment index increased 2 points to 9.4. Most firms reported steady part-time employment (57 percent), while 22 percent of the firms reported increases and 13 percent reported decreases. The average workweek index edged up 1 point to 11.9.
Prices Paid Index Reaches All-Time High
Price indicator readings suggest overall increases in prices for inputs and the firms' own goods and services. The prices paid index rose 16 points to 49.1 in May, its highest reading since this survey began in March 2011. Half of the respondents reported increases in their input prices, 31 percent reported no change, and 1 percent reported decreases. Regarding prices for the firms' own goods and services, the prices received index increased 2 points to 16.6 this month.
Firms Forecast Own Prices to Rise Slower Than Inflation
In this month's special questions, the firms were asked to forecast the changes in the prices of their own products and services and for U.S. consumers over the next four quarters (see Special Questions). Regarding their own prices, the firms' median forecast was for an increase of 3.0 percent, the same as when the question was last asked in February. Regarding the firms' own price change over the previous year, the median response was 1.6 percent, up from 1.0 percent in February. The firms expect their employee compensation costs (wages plus benefits per employee) to rise 3.0 percent over the next four quarters, unchanged from last quarter. When asked about the rate of inflation for U.S. consumers over the next year, the firms' median forecast was 4.0 percent, up from 2.5 percent in February. The firms' forecast for the long-run (10-year) inflation rate was unchanged at 4.0 percent.
Future Indicators Strengthen
Both future activity indexes suggest more widespread optimism about nonmanufacturing activity over the next six months. The diffusion index for future activity at the firm level rose from a reading of 49.3 in April to 67.1 this month (see Chart). Nearly 77 percent of the respondents (up from 66 percent last month) expect an increase in activity at their firms over the next six months, compared with 10 percent that expect decreases (down from 16 percent). The future regional activity index increased 14 points to 66.6 in May.
Summary
Responses to this month's Nonmanufacturing Business Outlook Survey indicated continued expansion in nonmanufacturing activity in the region. The indicators for firm-level general activity, sales/revenues, and new orders all remained positive. Additionally, the firms reported overall increases in employment, and the full-time employment index reached a two-year high. The future activity indexes suggest that respondents expect growth at their firms and in the region over the next six months.
Special Questions (May 2021)
|
Please list the annual percent change with respect to the following: |
|
Current
|
Previous
(February 2021)
|
|
For your firm:
|
|
Forecast for next year (2021Q2–2022Q2)
|
|
1. Prices your firm will receive (for its own goods and services sold).
|
3.0
|
3.0 |
|
2. Compensation your firm will pay per employee (for wages and benefits).
|
3.0
|
3.0
|
|
Last year's price change (2020Q2–2021Q2)
|
|
3. Prices your firm did receive (for its own goods and services sold) over the last year.
|
1.6 |
1.0
|
|
For U.S. consumers:
|
|
4. Prices consumers will pay for goods and services over the next year.
|
4.0
|
2.5 |
|
5. Prices U.S. consumers will pay for goods and services over the next 10 years (2021–2030).
|
4.0
|
4.0
|
|
The numbers represent medians of the individual forecasts (percent changes). For question 5, firms
reported a 10-year annual-average change.
|
Summary of Returns (May 2021)